健康检查与资源监控
在 MatrixOne 分布式集群中,包含了多个组件和对象,为了确保其正常运行并排除故障,我们需要进行一系列的健康检查和资源监控。
本篇文档所介绍到的健康检查与资源监控环境将基于 MatrixOne 分布式集群部署的环境。
检查对象
-
物理资源层:包括三台虚拟机的 CPU、内存和磁盘资源。有关监控这些资源的成熟方案,可以参考监控方案。在此不做过多介绍。
-
逻辑资源层:包括 MinIO 的容量使用情况,Kubernetes 的各个节点和 Pod 的 CPU 和内存资源使用情况,以及 MatrixOne 的整体状态和各个组件(如 LogService、CN、TN)的状态。
资源监控
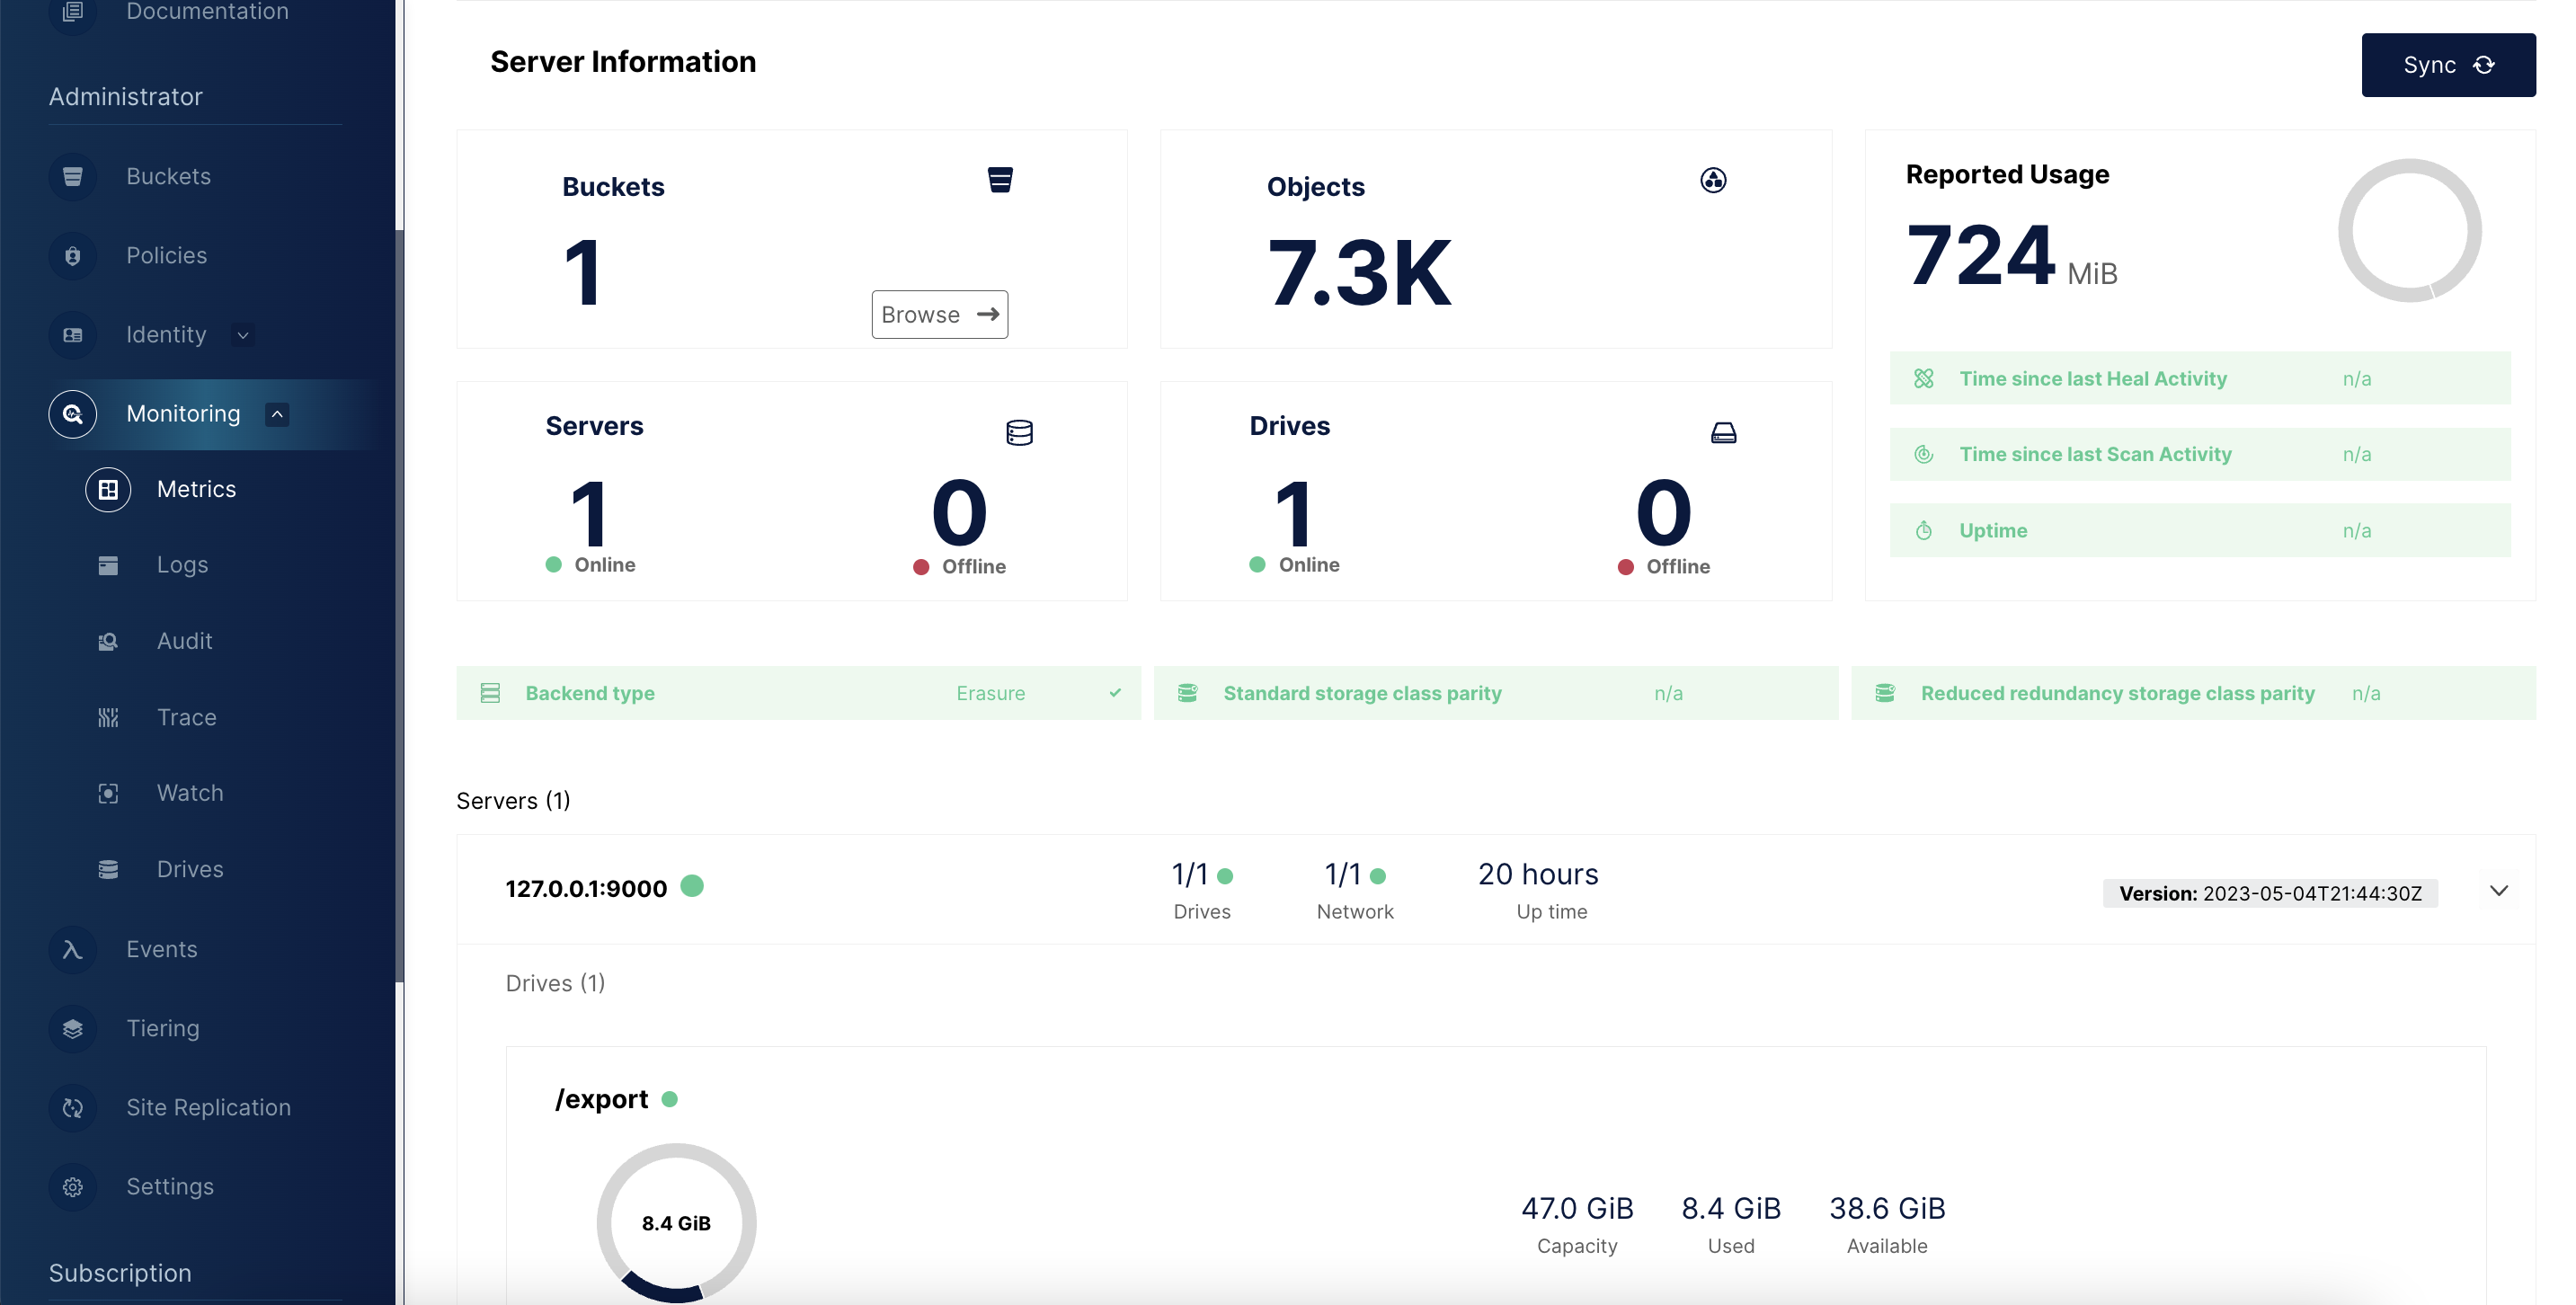
MinIO 容量使用监控
MinIO 自带了一个管理界面,通过该界面我们可以以可视化的方式监控其容量使用情况,包括剩余空间的数量等。有关详细信息,请参考官方文档。
Node/Pod 资源监控
为了确定 MatrixOne 服务是否需要扩缩容,用户往往需要针对 MatrixOne 集群所在 Node 和组件对应 Pod 所使用的资源进行监控。
你可以使用 kubectl top 命令完成,详细的命令可以参考对应版本的 Kubernetes 官网文档。
Node 监控
-
使用如下命令查看 MatrixOne 集群节点详情:
kubectl get node[root@master0 ~]# kubectl get node NAME STATUS ROLES AGE VERSION master0 Ready control-plane,master 22h v1.23.17 node0 Ready <none> 22h v1.23.17 -
根据上述返回结果,使用以下命令来查看特定节点的资源使用情况。根据之前的部署方案,可以查看到 MatrixOne 集群位于名为 node0 的节点上:
NODE="[待监控节点]" # 根据上述结果,有可能是 ip、也可能是主机名、或者别名,例如 10.0.0.1、host-10-0-0-1、node01
kubectl top node ${NODE}
[root@master0 ~]# kubectl top node NAME CPU(cores) CPU% MEMORY(bytes) MEMORY% master0 179m 9% 4632Mi 66% node0 292m 15% 4115Mi 56% [root@master0 ~]# kubectl top node node0 NAME CPU(cores) CPU% MEMORY(bytes) MEMORY% node0 299m 15% 4079Mi 56% -
你还可以查看节点的资源分配和资源上限。请注意,已分配的资源并不等于已使用的资源。
[root@master0 ~]# kubectl describe node node0
Name:               master0
Roles:              control-plane,master
Labels:             beta.kubernetes.io/arch=amd64
                    beta.kubernetes.io/os=linux
                    kubernetes.io/arch=amd64
                    kubernetes.io/hostname=master0
                    kubernetes.io/os=linux
                    node-role.kubernetes.io/control-plane=
                    node-role.kubernetes.io/master=
                    node.kubernetes.io/exclude-from-external-load-balancers=
Annotations:        kubeadm.alpha.kubernetes.io/cri-socket: /var/run/dockershim.sock
                    node.alpha.kubernetes.io/ttl: 0
                    projectcalico.org/IPv4Address: 10.206.134.8/24
                    projectcalico.org/IPv4VXLANTunnelAddr: 10.234.166.0
                    volumes.kubernetes.io/controller-managed-attach-detach: true
CreationTimestamp:  Sun, 07 May 2023 12:28:57 +0800
Taints:             node-role.kubernetes.io/master:NoSchedule
Unschedulable:      false
Lease:
  HolderIdentity:  master0
  AcquireTime:     <unset>
  RenewTime:       Mon, 08 May 2023 10:56:08 +0800
Conditions:
  Type                 Status  LastHeartbeatTime                 LastTransitionTime                Reason                       Message
  ----                 ------  -----------------                 ------------------                ------                       -------
  NetworkUnavailable   False   Sun, 07 May 2023 12:30:08 +0800   Sun, 07 May 2023 12:30:08 +0800   CalicoIsUp                   Calico is running on this node
  MemoryPressure       False   Mon, 08 May 2023 10:56:07 +0800   Sun, 07 May 2023 12:28:55 +0800   KubeletHasSufficientMemory   kubelet has sufficient memory available
  DiskPressure         False   Mon, 08 May 2023 10:56:07 +0800   Sun, 07 May 2023 12:28:55 +0800   KubeletHasNoDiskPressure     kubelet has no disk pressure
  PIDPressure          False   Mon, 08 May 2023 10:56:07 +0800   Sun, 07 May 2023 12:28:55 +0800   KubeletHasSufficientPID      kubelet has sufficient PID available
  Ready                True    Mon, 08 May 2023 10:56:07 +0800   Sun, 07 May 2023 20:47:39 +0800   KubeletReady                 kubelet is posting ready status
Addresses:
  InternalIP:  10.206.134.8
  Hostname:    master0
Capacity:
  cpu:                2
  ephemeral-storage:  51473868Ki
  hugepages-1Gi:      0
  hugepages-2Mi:      0
  memory:             7782436Ki
  pods:               110
Allocatable:
  cpu:                1800m
  ephemeral-storage:  47438316671
  hugepages-1Gi:      0
  hugepages-2Mi:      0
  memory:             7155748Ki
  pods:               110
System Info:
  Machine ID:                 fb436be013b5415799d27abf653585d3
  System UUID:                FB436BE0-13B5-4157-99D2-7ABF653585D3
  Boot ID:                    552bd576-56c8-4d22-9549-d950069a5a77
  Kernel Version:             3.10.0-1160.88.1.el7.x86_64
  OS Image:                   CentOS Linux 7 (Core)
  Operating System:           linux
  Architecture:               amd64
  Container Runtime Version:  docker://20.10.23
  Kubelet Version:            v1.23.17
  Kube-Proxy Version:         v1.23.17
PodCIDR:                      10.234.0.0/23
PodCIDRs:                     10.234.0.0/23
Non-terminated Pods:          (12 in total)
  Namespace                   Name                               CPU Requests  CPU Limits  Memory Requests  Memory Limits  Age
  ---------                   ----                               ------------  ----------  ---------------  -------------  ---
  default                     netchecker-agent-7xnwb             15m (0%)      30m (1%)    64M (0%)         100M (1%)      22h
  default                     netchecker-agent-hostnet-bw85f     15m (0%)      30m (1%)    64M (0%)         100M (1%)      22h
  kruise-system               kruise-daemon-xvl8t                0 (0%)        50m (2%)    0 (0%)           128Mi (1%)     20h
  kube-system                 calico-node-sbzfc                  150m (8%)     300m (16%)  64M (0%)         500M (6%)      22h
  kube-system                 dns-autoscaler-7874cf6bcf-l55q4    20m (1%)      0 (0%)      10Mi (0%)        0 (0%)         22h
  kube-system                 kube-apiserver-master0             250m (13%)    0 (0%)      0 (0%)           0 (0%)         22h
  kube-system                 kube-controller-manager-master0    200m (11%)    0 (0%)      0 (0%)           0 (0%)         22h
  kube-system                 kube-proxy-lfkhk                   0 (0%)        0 (0%)      0 (0%)           0 (0%)         22h
  kube-system                 kube-scheduler-master0             100m (5%)     0 (0%)      0 (0%)           0 (0%)         22h
  kube-system                 metrics-server-7bd47f88c4-knh9b    100m (5%)     100m (5%)   200Mi (2%)       200Mi (2%)     22h
  kube-system                 nodelocaldns-dcffl                 100m (5%)     0 (0%)      70Mi (1%)        170Mi (2%)     14h
  kuboard                     kuboard-v3-master0                 0 (0%)        0 (0%)      0 (0%)           0 (0%)         22h
Allocated resources:
  (Total limits may be over 100 percent, i.e., overcommitted.)
  Resource           Requests        Limits
  --------           --------        ------
  cpu                950m (52%)      510m (28%)
  memory             485601280 (6%)  1222190848 (16%)
  ephemeral-storage  0 (0%)          0 (0%)
  hugepages-1Gi      0 (0%)          0 (0%)
  hugepages-2Mi      0 (0%)          0 (0%)
Events:              <none>


Name:               node0
Roles:              <none>
Labels:             beta.kubernetes.io/arch=amd64
                    beta.kubernetes.io/os=linux
                    kubernetes.io/arch=amd64
                    kubernetes.io/hostname=node0
                    kubernetes.io/os=linux
Annotations:        kubeadm.alpha.kubernetes.io/cri-socket: /var/run/dockershim.sock
                    node.alpha.kubernetes.io/ttl: 0
                    projectcalico.org/IPv4Address: 10.206.134.14/24
                    projectcalico.org/IPv4VXLANTunnelAddr: 10.234.60.0
                    volumes.kubernetes.io/controller-managed-attach-detach: true
CreationTimestamp:  Sun, 07 May 2023 12:29:46 +0800
Taints:             <none>
Unschedulable:      false
Lease:
  HolderIdentity:  node0
  AcquireTime:     <unset>
  RenewTime:       Mon, 08 May 2023 10:56:06 +0800
Conditions:
  Type                 Status  LastHeartbeatTime                 LastTransitionTime                Reason                       Message
  ----                 ------  -----------------                 ------------------                ------                       -------
  NetworkUnavailable   False   Sun, 07 May 2023 12:30:08 +0800   Sun, 07 May 2023 12:30:08 +0800   CalicoIsUp                   Calico is running on this node
  MemoryPressure       False   Mon, 08 May 2023 10:56:12 +0800   Sun, 07 May 2023 12:29:46 +0800   KubeletHasSufficientMemory   kubelet has sufficient memory available
  DiskPressure         False   Mon, 08 May 2023 10:56:12 +0800   Sun, 07 May 2023 12:29:46 +0800   KubeletHasNoDiskPressure     kubelet has no disk pressure
  PIDPressure          False   Mon, 08 May 2023 10:56:12 +0800   Sun, 07 May 2023 12:29:46 +0800   KubeletHasSufficientPID      kubelet has sufficient PID available
  Ready                True    Mon, 08 May 2023 10:56:12 +0800   Sun, 07 May 2023 20:48:36 +0800   KubeletReady                 kubelet is posting ready status
Addresses:
  InternalIP:  10.206.134.14
  Hostname:    node0
Capacity:
  cpu:                2
  ephemeral-storage:  51473868Ki
  hugepages-1Gi:      0
  hugepages-2Mi:      0
  memory:             7782444Ki
  pods:               110
Allocatable:
  cpu:                1900m
  ephemeral-storage:  47438316671
  hugepages-1Gi:      0
  hugepages-2Mi:      0
  memory:             7417900Ki
  pods:               110
System Info:
  Machine ID:                 a6600151884b44fb9f0bc9af490e44b7
  System UUID:                A6600151-884B-44FB-9F0B-C9AF490E44B7
  Boot ID:                    b7f3357f-44e6-425e-8c90-6ada14e92703
  Kernel Version:             3.10.0-1160.88.1.el7.x86_64
  OS Image:                   CentOS Linux 7 (Core)
  Operating System:           linux
  Architecture:               amd64
  Container Runtime Version:  docker://20.10.23
  Kubelet Version:            v1.23.17
  Kube-Proxy Version:         v1.23.17
PodCIDR:                      10.234.2.0/23
PodCIDRs:                     10.234.2.0/23
Non-terminated Pods:          (20 in total)
  Namespace                   Name                                                         CPU Requests  CPU Limits  Memory Requests  Memory Limits  Age
  ---------                   ----                                                         ------------  ----------  ---------------  -------------  ---
  default                     netchecker-agent-6v8rl                                       15m (0%)      30m (1%)    64M (0%)         100M (1%)      22h
  default                     netchecker-agent-hostnet-fb2jn                               15m (0%)      30m (1%)    64M (0%)         100M (1%)      22h
  default                     netchecker-server-645d759b79-v4bqm                           150m (7%)     300m (15%)  192M (2%)        512M (6%)      22h
  kruise-system               kruise-controller-manager-74847d59cf-295rk                   100m (5%)     200m (10%)  256Mi (3%)       512Mi (7%)     20h
  kruise-system               kruise-controller-manager-74847d59cf-854sq                   100m (5%)     200m (10%)  256Mi (3%)       512Mi (7%)     20h
  kruise-system               kruise-daemon-rz9pj                                          0 (0%)        50m (2%)    0 (0%)           128Mi (1%)     20h
  kube-system                 calico-kube-controllers-74df5cd99c-n9qsn                     30m (1%)      1 (52%)     64M (0%)         256M (3%)      22h
  kube-system                 calico-node-brqrk                                            150m (7%)     300m (15%)  64M (0%)         500M (6%)      22h
  kube-system                 coredns-76b4fb4578-9cqc7                                     100m (5%)     0 (0%)      70Mi (0%)        170Mi (2%)     14h
  kube-system                 kube-proxy-rpxb5                                             0 (0%)        0 (0%)      0 (0%)           0 (0%)         22h
  kube-system                 nginx-proxy-node0                                            25m (1%)      0 (0%)      32M (0%)         0 (0%)         22h
  kube-system                 nodelocaldns-qkxhv                                           100m (5%)     0 (0%)      70Mi (0%)        170Mi (2%)     14h
  local-path-storage          local-path-storage-local-path-provisioner-d5bb7f8c9-qfp8h    0 (0%)        0 (0%)      0 (0%)           0 (0%)         21h
  mo-hn                       matrixone-operator-f8496ff5c-fp6zm                           0 (0%)        0 (0%)      0 (0%)           0 (0%)         20h
  mo-hn                       mo-tn-0                                                      0 (0%)        0 (0%)      0 (0%)           0 (0%)         13h
  mo-hn                       mo-log-0                                                     0 (0%)        0 (0%)      0 (0%)           0 (0%)         13h
  mo-hn                       mo-log-1                                                     0 (0%)        0 (0%)      0 (0%)           0 (0%)         13h
  mo-hn                       mo-log-2                                                     0 (0%)        0 (0%)      0 (0%)           0 (0%)         13h
  mo-hn                       mo-tp-cn-0                                                   0 (0%)        0 (0%)      0 (0%)           0 (0%)         13h
  mostorage                   minio-674ccf54f7-tdglh                                       0 (0%)        0 (0%)      512Mi (7%)       0 (0%)         20h
Allocated resources:
  (Total limits may be over 100 percent, i.e., overcommitted.)
  Resource           Requests          Limits
  --------           --------          ------
  cpu                785m (41%)        2110m (111%)
  memory             1700542464 (22%)  3032475392 (39%)
  ephemeral-storage  0 (0%)            0 (0%)
  hugepages-1Gi      0 (0%)            0 (0%)
  hugepages-2Mi      0 (0%)            0 (0%)
Events:              <none>
Pod 监控
-
通过以下命令可以查看 MatrixOne 集群的 Pod:
NS="mo-hn" kubectl get pod -n${NS} -
根据上述返回结果,使用以下命令来查看特定 Pod 的资源使用情况:
POD="[待监控 pod 名称]" # 根据上述结果,例如:tn 为 mo-tn-0,cn 为 mo-tp-cn-0、mo-tp-cn-1、...,logservice 为 mo-log-0、mo-log-1、...
kubectl top pod ${POD} -n${NS}
该命令将显示指定 Pod 的 CPU 和内存使用情况,类似于以下输出:
[root@master0 ~]# kubectl top pod mo-tp-cn-0 -nmo-hn NAME CPU(cores) MEMORY(bytes) mo-tp-cn-0 20m 214Mi [root@master0 ~]# kubectl top pod mo-tn-0 -nmo-hn NAME CPU(cores) MEMORY(bytes) mo-tn-0 36m 161Mi -
此外,你还可以查看特定 Pod 的资源声明情况,以便与实际使用的资源进行对比。
kubectl describe pod ${POD_NAME} -n${NS}
kubectl get pod ${POD_NAME} -n${NS} -oyaml
[root@master0 ~]# kubectl describe pod mo-tp-cn-0 -nmo-hn
Name:         mo-tp-cn-0
Namespace:    mo-hn
Priority:     0
Node:         node0/10.206.134.14
Start Time:   Sun, 07 May 2023 21:01:50 +0800
Labels:       controller-revision-hash=mo-tp-cn-8666cdfb56
              lifecycle.apps.kruise.io/state=Normal
              matrixorigin.io/cluster=mo
              matrixorigin.io/component=CNSet
              matrixorigin.io/instance=mo-tp
              matrixorigin.io/namespace=mo-hn
              statefulset.kubernetes.io/pod-name=mo-tp-cn-0
Annotations:  apps.kruise.io/runtime-containers-meta:
                {"containers":[{"name":"main","containerID":"docker://679d672a330d7318f97a90835dacefcdd03e8a08062b8844d438f8cdd6bcdc8f","restartCount":0,"...
              cni.projectcalico.org/containerID: 80b286789a2d6fa9e615c3edee79b57edb452eaeafddb9b7b82ec5fb2e339409
              cni.projectcalico.org/podIP: 10.234.60.53/32
              cni.projectcalico.org/podIPs: 10.234.60.53/32
              kruise.io/related-pub: mo
              lifecycle.apps.kruise.io/timestamp: 2023-05-07T13:01:50Z
              matrixone.cloud/cn-label: null
              matrixone.cloud/dns-based-identity: False
Status:       Running
IP:           10.234.60.53
IPs:
  IP:           10.234.60.53
Controlled By:  StatefulSet/mo-tp-cn
Containers:
  main:
    Container ID:  docker://679d672a330d7318f97a90835dacefcdd03e8a08062b8844d438f8cdd6bcdc8f
    Image:         matrixorigin/matrixone:nightly-144f3be4
    Image ID:      docker-pullable://matrixorigin/matrixone@sha256:288fe3d626c6aa564684099e4686a9d4b28e16fdd16512bd968a67bb41d5aaa3
    Port:          <none>
    Host Port:     <none>
    Command:
      /bin/sh
      /etc/matrixone/config/start.sh
    Args:
      -debug-http=:6060
    State:          Running
      Started:      Sun, 07 May 2023 21:01:54 +0800
    Ready:          True
    Restart Count:  0
    Environment:
      POD_NAME:               mo-tp-cn-0 (v1:metadata.name)
      NAMESPACE:              mo-hn (v1:metadata.namespace)
      HEADLESS_SERVICE_NAME:  mo-tp-cn-headless
      AWS_ACCESS_KEY_ID:      <set to the key 'AWS_ACCESS_KEY_ID' in secret 'minio'>      Optional: false
      AWS_SECRET_ACCESS_KEY:  <set to the key 'AWS_SECRET_ACCESS_KEY' in secret 'minio'>  Optional: false
      AWS_REGION:             us-west-2
    Mounts:
      /etc/matrixone/config from config (ro)
      /var/run/secrets/kubernetes.io/serviceaccount from kube-api-access-ngpcs (ro)
Readiness Gates:
  Type                 Status
  InPlaceUpdateReady   True
  KruisePodReady       True
Conditions:
  Type                 Status
  KruisePodReady       True
  InPlaceUpdateReady   True
  Initialized          True
  Ready                True
  ContainersReady      True
  PodScheduled         True
Volumes:
  config:
    Type:      ConfigMap (a volume populated by a ConfigMap)
    Name:      mo-tp-cn-config-5abf454
    Optional:  false
  kube-api-access-ngpcs:
    Type:                    Projected (a volume that contains injected data from multiple sources)
    TokenExpirationSeconds:  3607
    ConfigMapName:           kube-root-ca.crt
    ConfigMapOptional:       <nil>
    DownwardAPI:             true
QoS Class:                   BestEffort
Node-Selectors:              <none>
Tolerations:                 node.kubernetes.io/not-ready:NoExecute op=Exists for 300s
                             node.kubernetes.io/unreachable:NoExecute op=Exists for 300s
Events:                      <none>
[root@master0 ~]# kubectl get pod  mo-tp-cn-0 -nmo-hn -oyaml
apiVersion: v1
kind: Pod
metadata:
  annotations:
    apps.kruise.io/runtime-containers-meta: '{"containers":[{"name":"main","containerID":"docker://679d672a330d7318f97a90835dacefcdd03e8a08062b8844d438f8cdd6bcdc8f","restartCount":0,"hashes":{"plainHash":1670287891}}]}'
    cni.projectcalico.org/containerID: 80b286789a2d6fa9e615c3edee79b57edb452eaeafddb9b7b82ec5fb2e339409
    cni.projectcalico.org/podIP: 10.234.60.53/32
    cni.projectcalico.org/podIPs: 10.234.60.53/32
    kruise.io/related-pub: mo
    lifecycle.apps.kruise.io/timestamp: "2023-05-07T13:01:50Z"
    matrixone.cloud/cn-label: "null"
    matrixone.cloud/dns-based-identity: "False"
  creationTimestamp: "2023-05-07T13:01:50Z"
  generateName: mo-tp-cn-
  labels:
    controller-revision-hash: mo-tp-cn-8666cdfb56
    lifecycle.apps.kruise.io/state: Normal
    matrixorigin.io/cluster: mo
    matrixorigin.io/component: CNSet
    matrixorigin.io/instance: mo-tp
    matrixorigin.io/namespace: mo-hn
    statefulset.kubernetes.io/pod-name: mo-tp-cn-0
  name: mo-tp-cn-0
  namespace: mo-hn
  ownerReferences:
  - apiVersion: apps.kruise.io/v1beta1
    blockOwnerDeletion: true
    controller: true
    kind: StatefulSet
    name: mo-tp-cn
    uid: 891e0453-89a5-45d5-ad12-16ef048c804f
  resourceVersion: "72625"
  uid: 1e3e2df3-f1c2-4444-8694-8d23e7125d35
spec:
  containers:
  - args:
    - -debug-http=:6060
    command:
    - /bin/sh
    - /etc/matrixone/config/start.sh
    env:
    - name: POD_NAME
      valueFrom:
        fieldRef:
          apiVersion: v1
          fieldPath: metadata.name
    - name: NAMESPACE
      valueFrom:
        fieldRef:
          apiVersion: v1
          fieldPath: metadata.namespace
    - name: HEADLESS_SERVICE_NAME
      value: mo-tp-cn-headless
    - name: AWS_ACCESS_KEY_ID
      valueFrom:
        secretKeyRef:
          key: AWS_ACCESS_KEY_ID
          name: minio
    - name: AWS_SECRET_ACCESS_KEY
      valueFrom:
        secretKeyRef:
          key: AWS_SECRET_ACCESS_KEY
          name: minio
    - name: AWS_REGION
      value: us-west-2
    image: matrixorigin/matrixone:nightly-144f3be4
    imagePullPolicy: Always
    name: main
    resources: {}
    terminationMessagePath: /dev/termination-log
    terminationMessagePolicy: File
    volumeMounts:
    - mountPath: /etc/matrixone/config
      name: config
      readOnly: true
    - mountPath: /var/run/secrets/kubernetes.io/serviceaccount
      name: kube-api-access-ngpcs
      readOnly: true
  dnsPolicy: ClusterFirst
  enableServiceLinks: true
  hostname: mo-tp-cn-0
  nodeName: node0
  preemptionPolicy: PreemptLowerPriority
  priority: 0
  readinessGates:
  - conditionType: InPlaceUpdateReady
  - conditionType: KruisePodReady
  restartPolicy: Always
  schedulerName: default-scheduler
  securityContext: {}
  serviceAccount: default
  serviceAccountName: default
  subdomain: mo-tp-cn-headless
  terminationGracePeriodSeconds: 30
  tolerations:
  - effect: NoExecute
    key: node.kubernetes.io/not-ready
    operator: Exists
    tolerationSeconds: 300
  - effect: NoExecute
    key: node.kubernetes.io/unreachable
    operator: Exists
    tolerationSeconds: 300
  volumes:
  - configMap:
      defaultMode: 420
      name: mo-tp-cn-config-5abf454
    name: config
  - name: kube-api-access-ngpcs
    projected:
      defaultMode: 420
      sources:
      - serviceAccountToken:
          expirationSeconds: 3607
          path: token
      - configMap:
          items:
          - key: ca.crt
            path: ca.crt
          name: kube-root-ca.crt
      - downwardAPI:
          items:
          - fieldRef:
              apiVersion: v1
              fieldPath: metadata.namespace
            path: namespace
status:
  conditions:
  - lastProbeTime: null
    lastTransitionTime: "2023-05-07T13:01:50Z"
    status: "True"
    type: KruisePodReady
  - lastProbeTime: null
    lastTransitionTime: "2023-05-07T13:01:50Z"
    status: "True"
    type: InPlaceUpdateReady
  - lastProbeTime: null
    lastTransitionTime: "2023-05-07T13:01:50Z"
    status: "True"
    type: Initialized
  - lastProbeTime: null
    lastTransitionTime: "2023-05-07T13:01:54Z"
    status: "True"
    type: Ready
  - lastProbeTime: null
    lastTransitionTime: "2023-05-07T13:01:54Z"
    status: "True"
    type: ContainersReady
  - lastProbeTime: null
    lastTransitionTime: "2023-05-07T13:01:50Z"
    status: "True"
    type: PodScheduled
  containerStatuses:
  - containerID: docker://679d672a330d7318f97a90835dacefcdd03e8a08062b8844d438f8cdd6bcdc8f
    image: matrixorigin/matrixone:nightly-144f3be4
    imageID: docker-pullable://matrixorigin/matrixone@sha256:288fe3d626c6aa564684099e4686a9d4b28e16fdd16512bd968a67bb41d5aaa3
    lastState: {}
    name: main
    ready: true
    restartCount: 0
    started: true
    state:
      running:
        startedAt: "2023-05-07T13:01:54Z"
  hostIP: 10.206.134.14
  phase: Running
  podIP: 10.234.60.53
  podIPs:
  - ip: 10.234.60.53
  qosClass: BestEffort
  startTime: "2023-05-07T13:01:50Z"
MatrixOne 监控
查看集群状态
在 Operator 部署过程中,我们定义了 matrixOnecluster 作为整个集群的自定义资源名称。通过检查 MatrixOneCluster,我们可以判断集群是否正常运行。你可以使用以下命令进行检查:
MO_NAME="mo"
NS="mo-hn"
kubectl get matrixonecluster -n${NS} ${MO_NAME}
如果状态为 "Ready",则表示集群正常。如果状态为 "NotReady",则需要进一步排查问题。
[root@master0 ~]# MO_NAME="mo"
[root@master0 ~]# NS="mo-hn"
[root@master0 ~]# kubectl get matrixonecluster -n${NS} ${MO_NAME}
NAME   LOG   TN    TP    AP    VERSION            PHASE   AGE
mo     3     1     1           nightly-144f3be4   Ready   13h
要查看 MatrixOne 集群状态的详细信息,可以运行以下命令:
kubectl describe matrixonecluster -n${NS} ${MO_NAME}
[root@master0 ~]# kubectl describe matrixonecluster -n${NS} ${MO_NAME}
Name:         mo
Namespace:    mo-hn
Labels:       <none>
Annotations:  <none>
API Version:  core.matrixorigin.io/v1alpha1
Kind:         MatrixOneCluster
Metadata:
  Creation Timestamp:  2023-05-07T12:54:17Z
  Finalizers:
    matrixorigin.io/matrixonecluster
  Generation:  2
  Managed Fields:
    API Version:  core.matrixorigin.io/v1alpha1
    Fields Type:  FieldsV1
    fieldsV1:
      f:metadata:
        f:annotations:
          .:
          f:kubectl.kubernetes.io/last-applied-configuration:
      f:spec:
        .:
        f:Tn:
          .:
          f:config:
          f:replicas:
        f:imagePullPolicy:
        f:imageRepository:
        f:logService:
          .:
          f:config:
          f:pvcRetentionPolicy:
          f:replicas:
          f:sharedStorage:
            .:
            f:s3:
              .:
              f:endpoint:
              f:secretRef:
              f:type:
          f:volume:
            .:
            f:size:
        f:tp:
          .:
          f:config:
          f:nodePort:
          f:replicas:
          f:serviceType:
        f:version:
    Manager:      kubectl-client-side-apply
    Operation:    Update
    Time:         2023-05-07T12:54:17Z
    API Version:  core.matrixorigin.io/v1alpha1
    Fields Type:  FieldsV1
    fieldsV1:
      f:metadata:
        f:finalizers:
          .:
          v:"matrixorigin.io/matrixonecluster":
    Manager:      manager
    Operation:    Update
    Time:         2023-05-07T12:54:17Z
    API Version:  core.matrixorigin.io/v1alpha1
    Fields Type:  FieldsV1
    fieldsV1:
      f:spec:
        f:logService:
          f:sharedStorage:
            f:s3:
              f:path:
    Manager:      kubectl-edit
    Operation:    Update
    Time:         2023-05-07T13:00:53Z
    API Version:  core.matrixorigin.io/v1alpha1
    Fields Type:  FieldsV1
    fieldsV1:
      f:status:
        .:
        f:cnGroups:
          .:
          f:desiredGroups:
          f:readyGroups:
          f:syncedGroups:
        f:conditions:
        f:credentialRef:
        f:Tn:
          .:
          f:availableStores:
          f:conditions:
        f:logService:
          .:
          f:availableStores:
          f:conditions:
          f:discovery:
            .:
            f:address:
            f:port:
        f:phase:
    Manager:         manager
    Operation:       Update
    Subresource:     status
    Time:            2023-05-07T13:02:12Z
  Resource Version:  72671
  UID:               be2355c0-0c69-4f0f-95bb-9310224200b6
Spec:
  Tn:
    Config:
[dn]

[dn.Ckp]
flush-interval = "60s"
global-interval = "100000s"
incremental-interval = "60s"
min-count = 100
scan-interval = "5s"

[dn.Txn]

[dn.Txn.Storage]
backend = "TAE"
log-backend = "logservice"

[log]
format = "json"
level = "error"
max-size = 512

    Replicas:  1
    Resources:
    Service Args:
      -debug-http=:6060
    Shared Storage Cache:
      Memory Cache Size:  0
  Image Pull Policy:      Always
  Image Repository:       matrixorigin/matrixone
  Log Service:
    Config:
[log]
format = "json"
level = "error"
max-size = 512

    Initial Config:
      TN Shards:           1
      Log Shard Replicas:  3
      Log Shards:          1
    Pvc Retention Policy:  Retain
    Replicas:              3
    Resources:
    Service Args:
      -debug-http=:6060
    Shared Storage:
      s3:
        Endpoint:           http://minio.mostorage:9000
        Path:               minio-mo
        s3RetentionPolicy:  Retain
        Secret Ref:
          Name:             minio
        Type:               minio
    Store Failure Timeout:  10m0s
    Volume:
      Size:  1Gi
  Tp:
    Config:
[cn]

[cn.Engine]
type = "distributed-tae"

[log]
format = "json"
level = "debug"
max-size = 512

    Node Port:  31474
    Replicas:   1
    Resources:
    Service Args:
      -debug-http=:6060
    Service Type:  NodePort
    Shared Storage Cache:
      Memory Cache Size:  0
  Version:                nightly-144f3be4
Status:
  Cn Groups:
    Desired Groups:  1
    Ready Groups:    1
    Synced Groups:   1
  Conditions:
    Last Transition Time:  2023-05-07T13:02:14Z
    Message:               the object is synced
    Reason:                empty
    Status:                True
    Type:                  Synced
    Last Transition Time:  2023-05-07T13:02:14Z
    Message:
    Reason:                AllSetsReady
    Status:                True
    Type:                  Ready
  Credential Ref:
    Name:  mo-credential
  Tn:
    Available Stores:
      Last Transition:  2023-05-07T13:01:48Z
      Phase:            Up
      Pod Name:         mo-tn-0
    Conditions:
      Last Transition Time:  2023-05-07T13:01:48Z
      Message:               the object is synced
      Reason:                empty
      Status:                True
      Type:                  Synced
      Last Transition Time:  2023-05-07T13:01:48Z
      Message:
      Reason:                empty
      Status:                True
      Type:                  Ready
  Log Service:
    Available Stores:
      Last Transition:  2023-05-07T13:01:25Z
      Phase:            Up
      Pod Name:         mo-log-0
      Last Transition:  2023-05-07T13:01:25Z
      Phase:            Up
      Pod Name:         mo-log-1
      Last Transition:  2023-05-07T13:01:25Z
      Phase:            Up
      Pod Name:         mo-log-2
    Conditions:
      Last Transition Time:  2023-05-07T13:01:25Z
      Message:               the object is synced
      Reason:                empty
      Status:                True
      Type:                  Synced
      Last Transition Time:  2023-05-07T13:01:25Z
      Message:
      Reason:                empty
      Status:                True
      Type:                  Ready
    Discovery:
      Address:  mo-log-discovery.mo-hn.svc
      Port:     32001
  Phase:        Ready
Events:
  Type    Reason            Age                From              Message
  ----    ------            ----               ----              -------
  Normal  ReconcileSuccess  29m (x2 over 13h)  matrixonecluster  object is synced
查看组件状态
当前 MatrixOne 集群包含以下组件:TN、CN、Log Service,它们分别对应着自定义资源类型 TNSet、CNSet、LogSet,这些对象由 MatrixOneCluster 控制器生成。
要检查各组件是否正常,以 TN 为例,可以运行以下命令:
SET_TYPE="tnset"
NS="mo-hn"
kubectl get ${SET_TYPE} -n${NS}
这将显示 TN 组件的状态信息,信息如下:
[root@master0 ~]# SET_TYPE="tnset"
[root@master0 ~]# NS="mo-hn"
[root@master0 ~]# kubectl get ${SET_TYPE} -n${NS}
NAME   IMAGE                                     REPLICAS   AGE
mo     matrixorigin/matrixone:nightly-144f3be4   1          13h
[root@master0 ~]# SET_TYPE="cnset"
[root@master0 ~]# kubectl get ${SET_TYPE} -n${NS}
NAME    IMAGE                                     REPLICAS   AGE
mo-tp   matrixorigin/matrixone:nightly-144f3be4   1          13h
[root@master0 ~]# SET_TYPE="logset"
[root@master0 ~]# kubectl get ${SET_TYPE} -n${NS}
NAME   IMAGE                                     REPLICAS   AGE
mo     matrixorigin/matrixone:nightly-144f3be4   3          13h
查看 Pod 状态
你可以直接检查 MO 集群中生成的原生 Kubernetes 对象,以确认集群的健康状态。通常,通过查询 Pod 即可完成。
NS="mo-hn"
kubectl get pod -n${NS}
这将显示 Pod 的状态信息。
[root@master0 ~]# NS="mo-hn"
[root@master0 ~]# kubectl get pod -n${NS}
NAME                                 READY   STATUS    RESTARTS   AGE
matrixone-operator-f8496ff5c-fp6zm   1/1     Running   0          19h
mo-tn-0                              1/1     Running   0          13h
mo-log-0                             1/1     Running   0          13h
mo-log-1                             1/1     Running   0          13h
mo-log-2                             1/1     Running   0          13h
mo-tp-cn-0                           1/1     Running   0          13h
通常情况下,Running 状态表示 Pod 正常运行。但也有一些特殊情况,可能 Pod 状态为 Running,但 MatrixOne 集群实际上不正常。例如,无法通过 MySQL 客户端连接 MatrixOne 集群。在这种情况下,您可以进一步查看 Pod 的日志,以检查是否有异常信息输出。
NS="mo-hn"
POD_NAME="[上述返回pod的名称]" # 例如mo-tp-cn-0
kubectl logs ${POD_NAME} -n${NS}
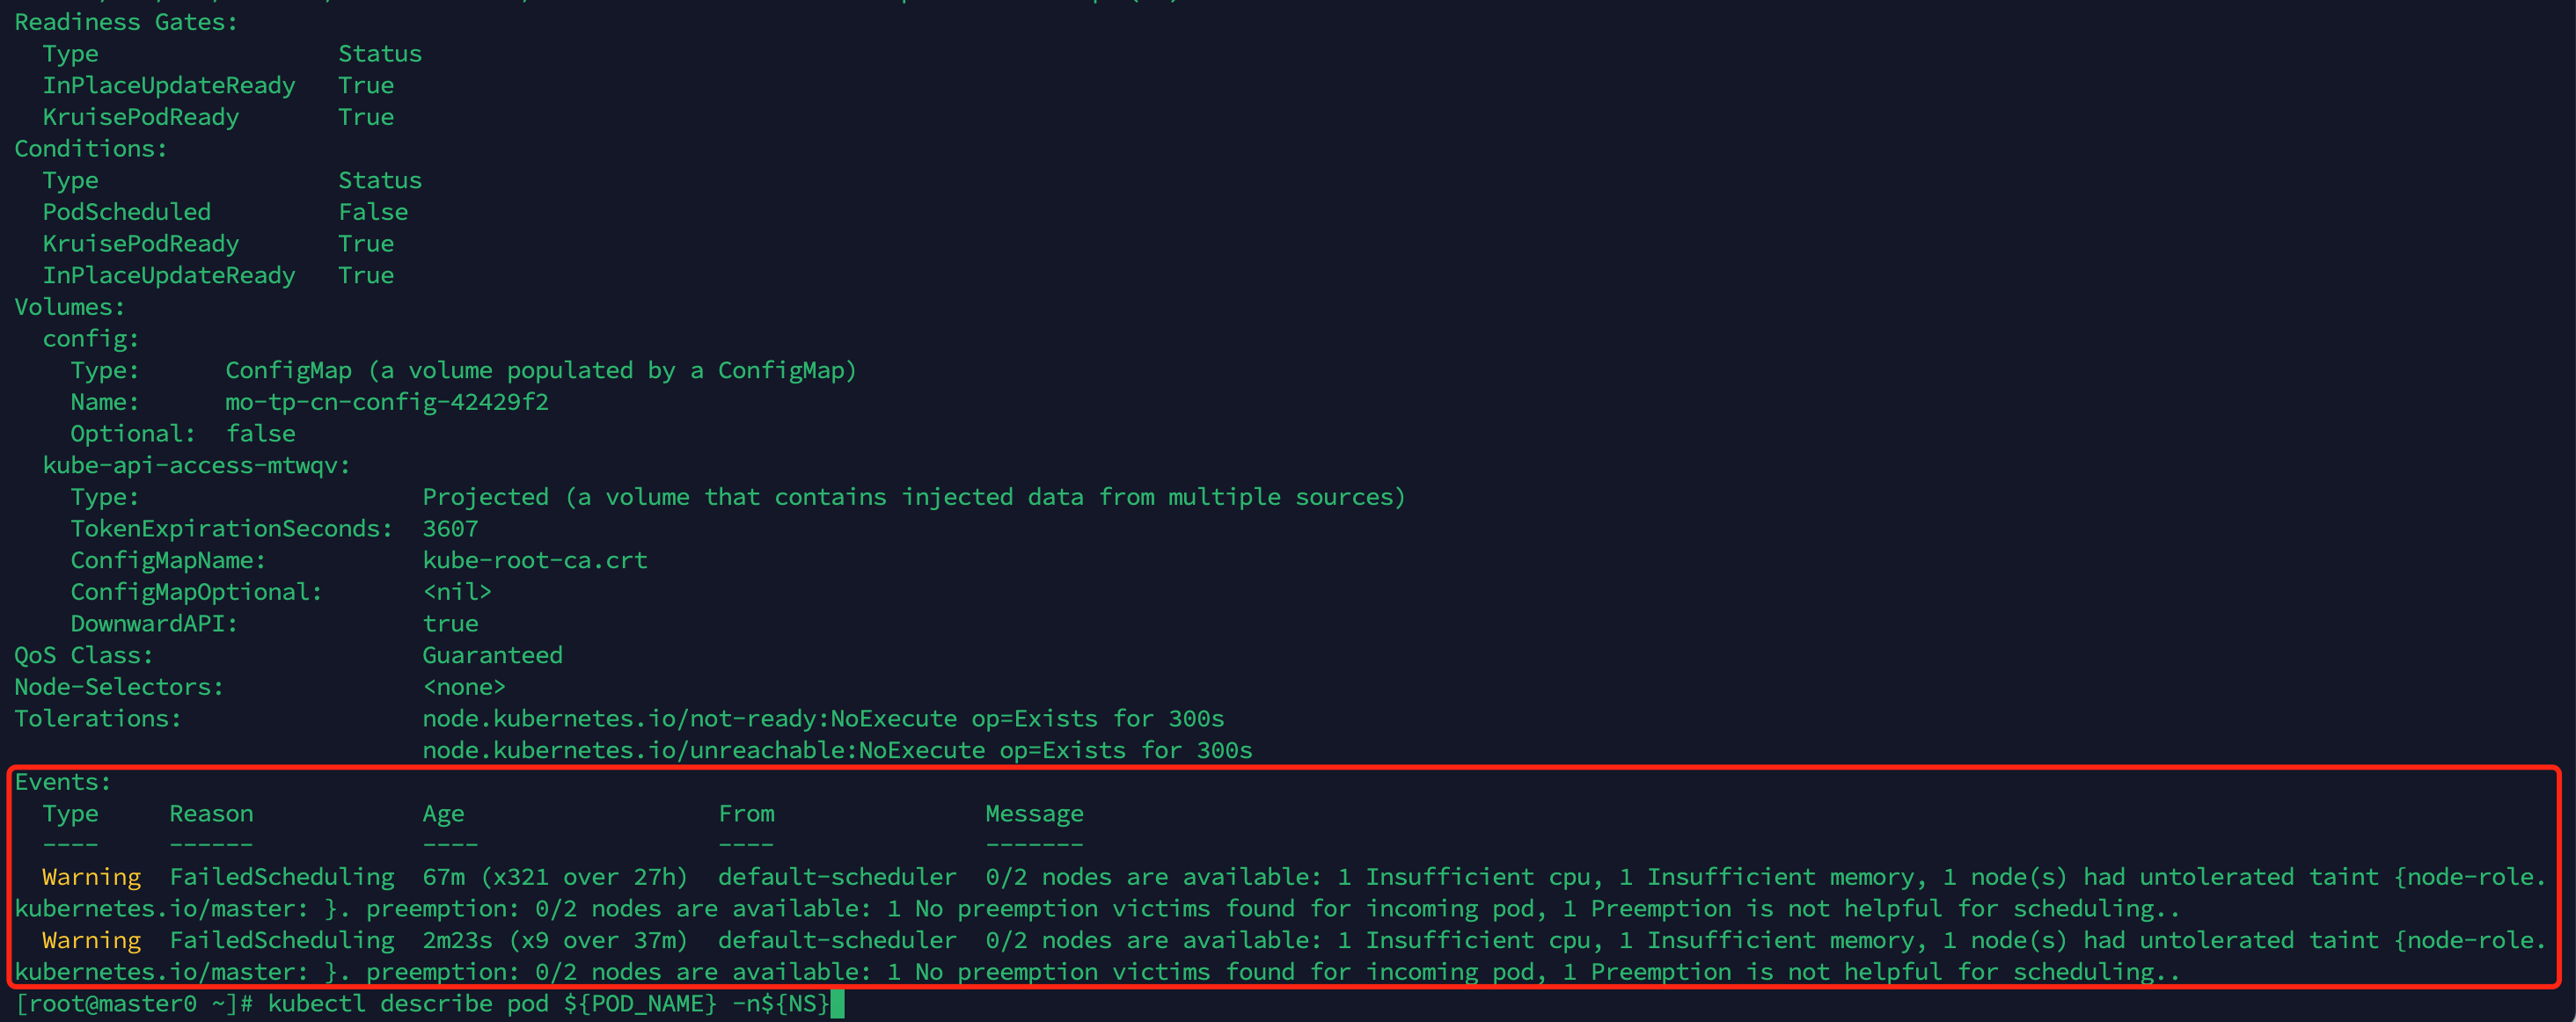
如果 Pod 状态为非 Running 状态,例如 Pending,您可以通过查看 Pod 的事件(Events)来确认异常原因。以前面的例子为例,由于集群资源无法满足 mo-tp-cn-3 的请求,该 Pod 无法调度,并处于 Pending 状态。在这种情况下,您可以通过扩容节点资源来解决。
kubectl describe pod ${POD_NAME} -n${NS}