

Query metrics in Grafana with an agent
MOI agents use connectors to work with external tools. An agent can look up issues in GitHub or check monitoring metrics in Grafana. This tutorial shows you how to connect Grafana to an agent and ask how many instances of a service Prometheus is currently scraping successfully.
Before you begin
A MOI workspace where you can configure connectors and edit agents.
A Grafana instance reachable from MOI, with a Prometheus data source that contains metrics for your service.
1. Configure Grafana in MOI
In Grafana, go to Administration → Users and access → Service accounts. Select Add service account and grant the account permission to query the target data source.
Open the service account, select Add service account token, and set a name and expiration date. Select Generate token and copy the value. See Grafana service accounts.
In MOI, go to Agent → Resource Center → Connectors · Channels · Tools → Connectors and search for Grafana. Select Configure or Manage to open the instance list, then select New. If you already have an instance you can use, go to step 2.
Field |
Value |
|---|---|
Tool Instance Name |
A name such as |
Grafana URL |
The base URL, such as |
Service Account Token |
The token copied from Grafana, without the |
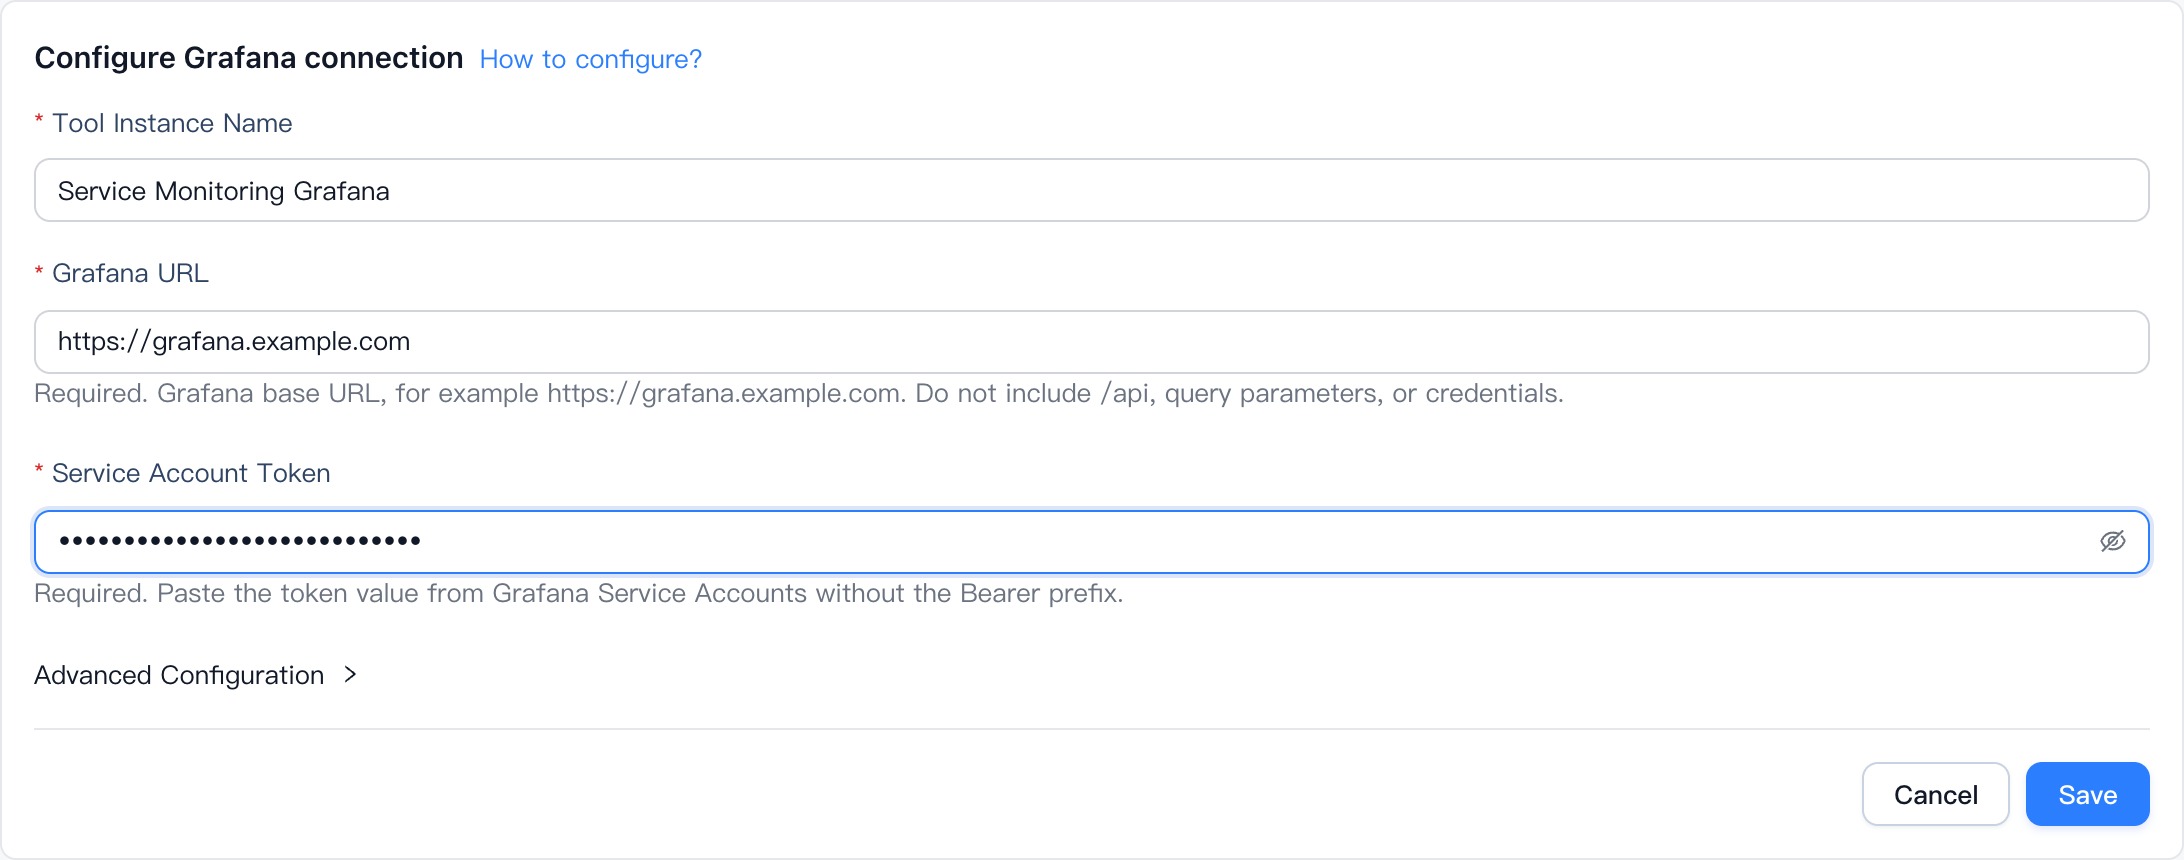
Select Save, then Test Connection in the instance list. Once the test passes, you can bind the instance to an agent. For more on the connection fields, see Configure Grafana.
2. Bind Grafana to the agent
Open the target agent’s details. Next to Bound Tools, select Add. Choose Grafana and the instance you configured, then save. Check that Grafana appears under Bound Tools.
3. Query a metric in chat
Return to the agent list and select Use for that agent. In the message below, replace demo-api with your Prometheus job name, then send it.
Use Grafana to check how many demo-api instances are currently being scraped successfully.
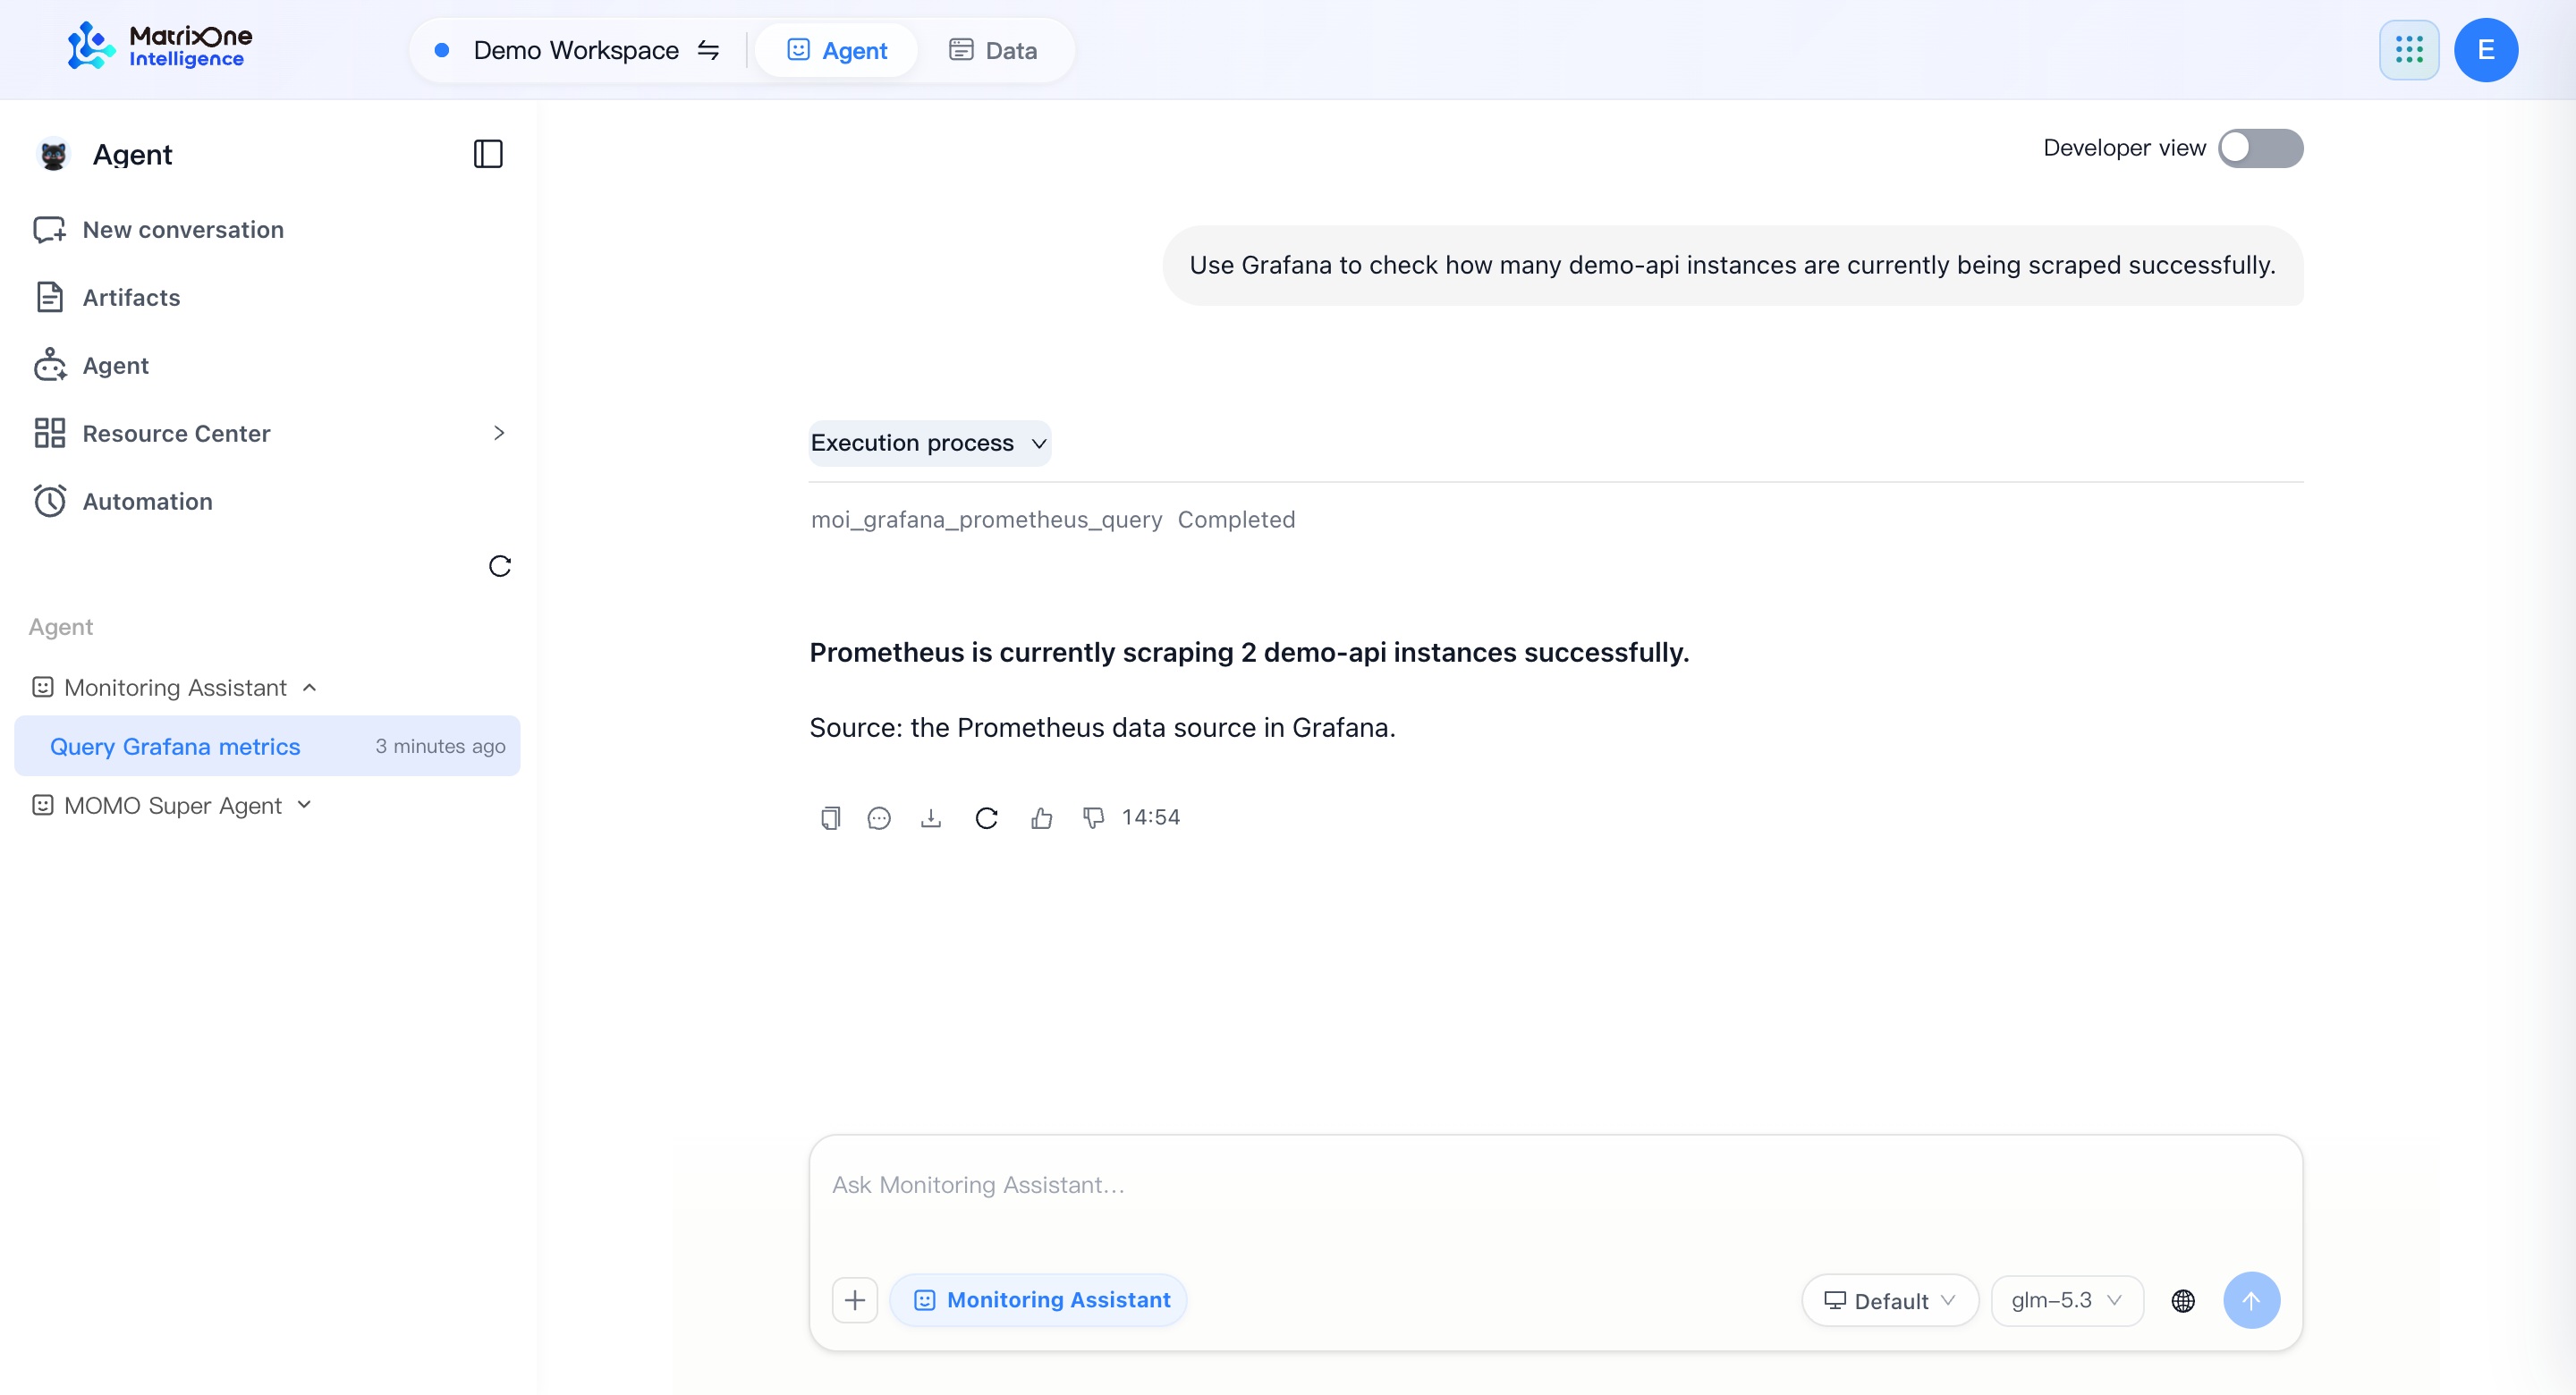
Expand Execution process in the conversation and check that the Grafana Prometheus query (moi_grafana_prometheus_query) completed. In the example, Prometheus successfully scraped two targets. If the query returns no samples, check the data source and the service’s job label. See Prometheus jobs and instances.