

Observe runtime activity
Use the Genesis console’s Dashboard, Usage, Logs, and Notifications to observe invocation status, resource consumption, and anomalies. If a call is abnormal, first use the dashboard to determine the scope of impact, then use logs to locate the individual request. To analyze cost or Token consumption over a period, use the Usage page.
View an overview on the dashboard
Open Dashboard in the left navigation. The page shows an operational overview for the current API Key scope, including current QPM, active connections, model availability, queue waiting, today’s requests, Token consumption, cost, and success rate.
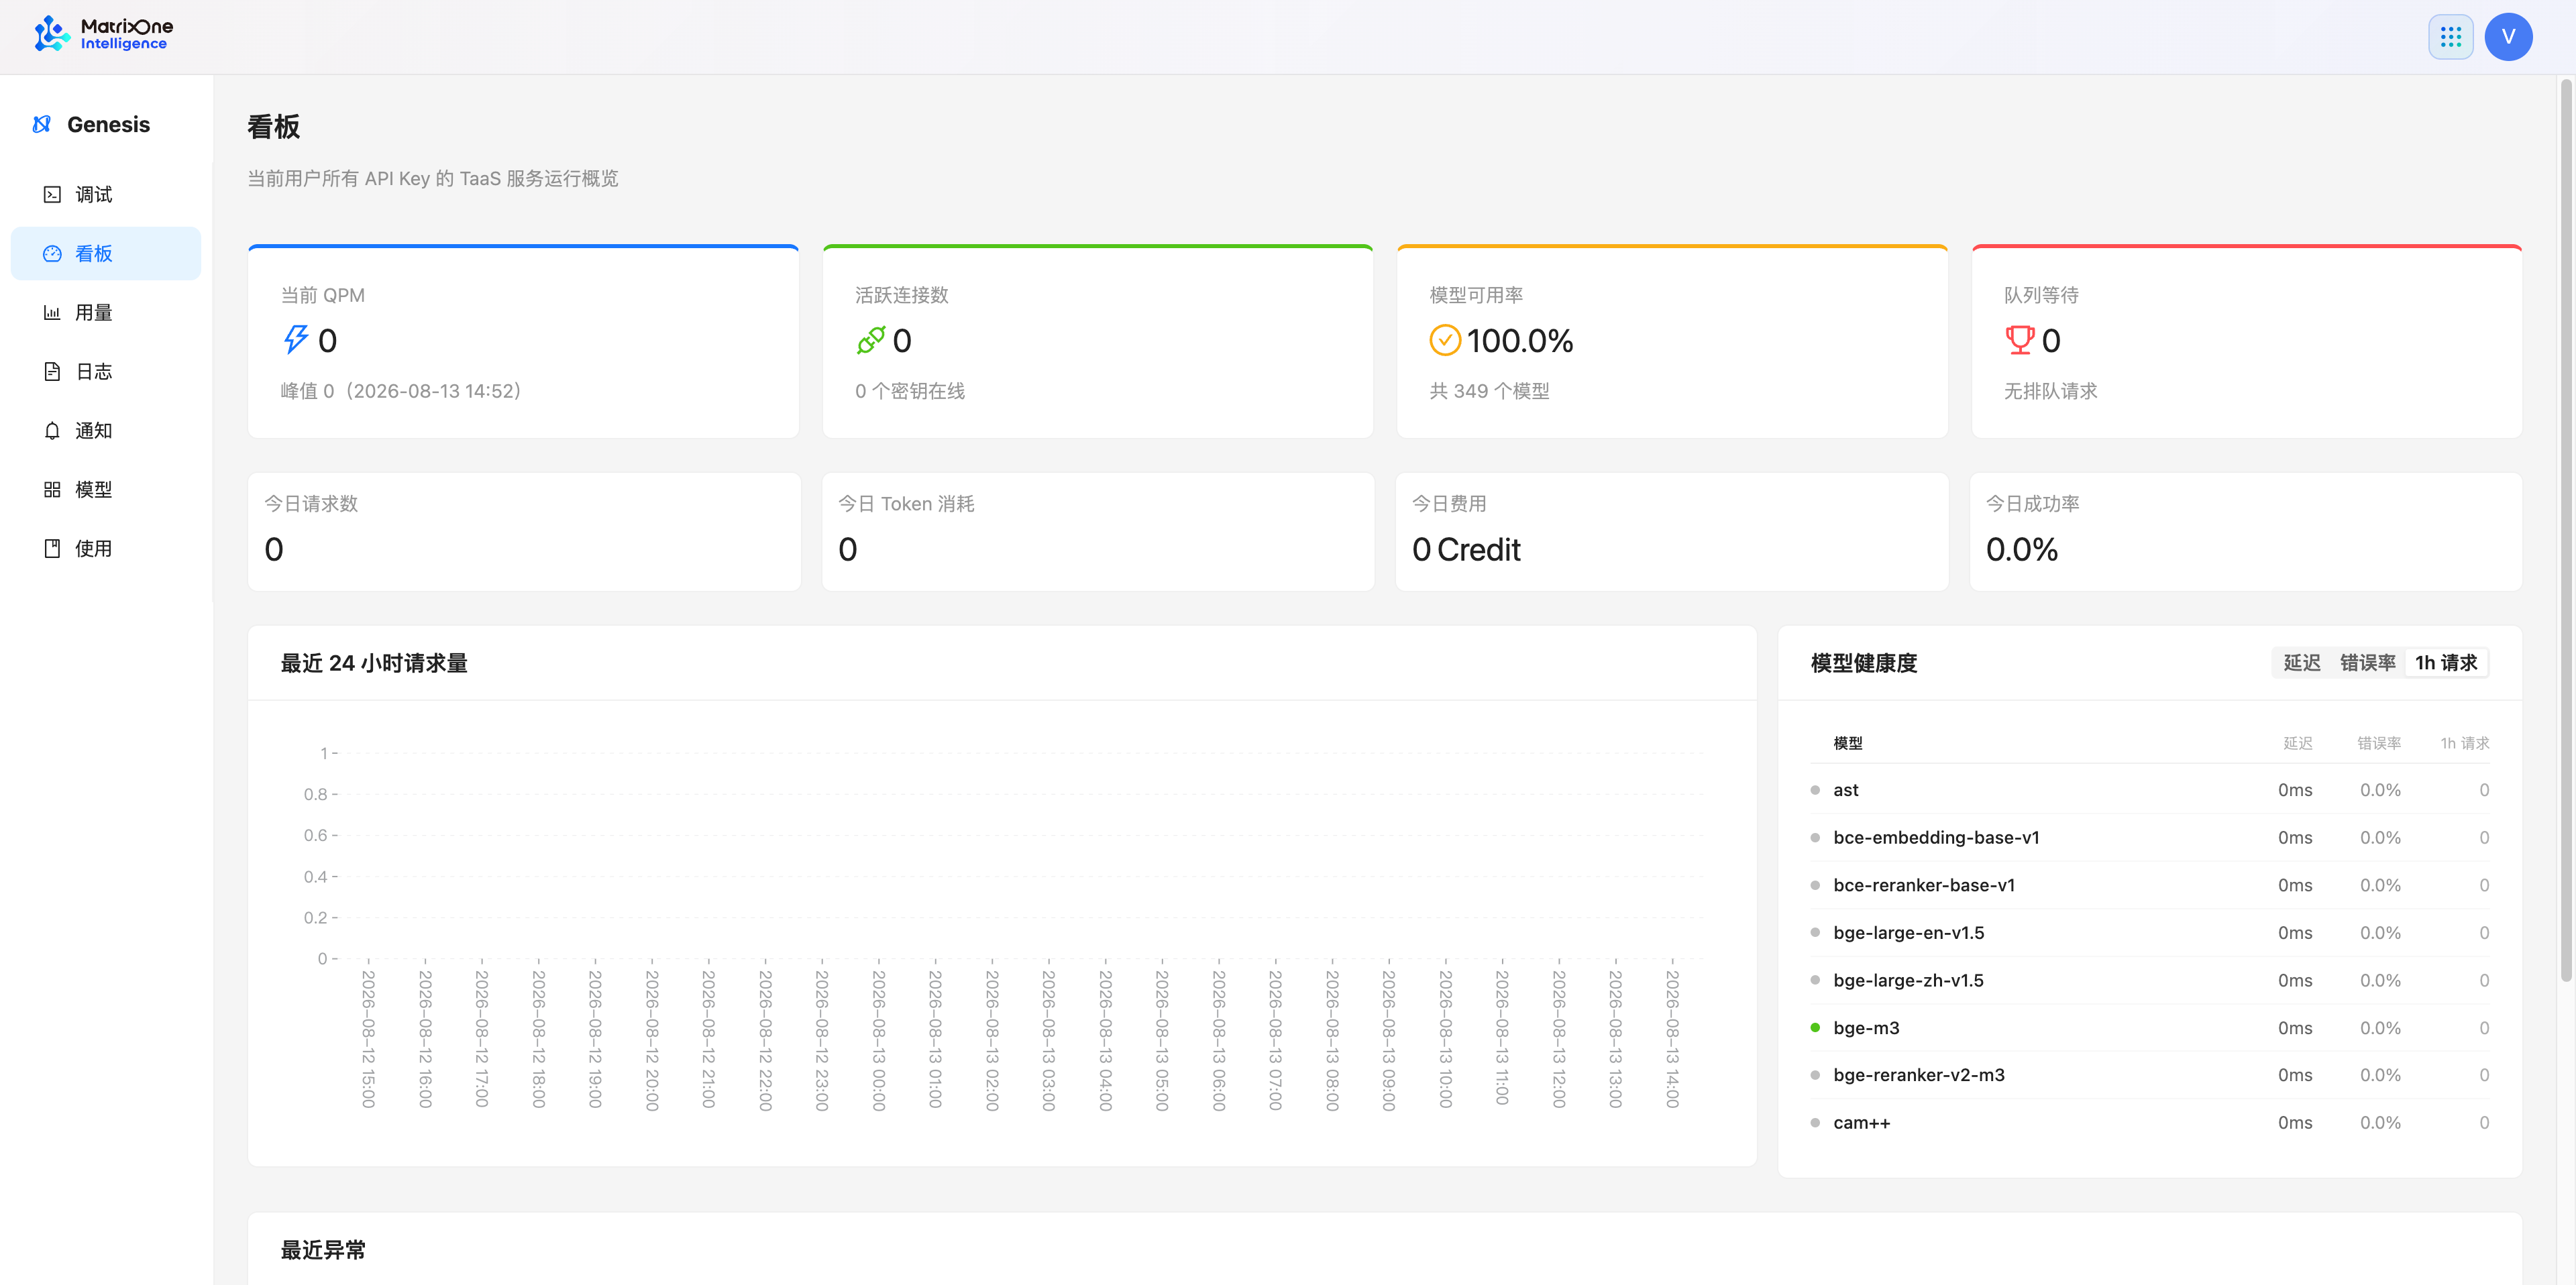
Focus on these areas:
Area |
Purpose |
Next step when an anomaly appears |
|---|---|---|
Current QPM, active connections, and queue waiting |
Assess current request pressure and queueing. |
Compare with request volume in the last 24 hours to determine whether this is a short-term traffic change. |
Model availability and model health |
View model latency, error rate, and requests in the last hour. |
Sort by latency, error rate, or requests in the last hour to locate the abnormal model. |
Today’s requests, Tokens, cost, and success rate |
Assess the day’s call volume, consumption, and success. |
Open Usage to view details by model or credential. |
Recent anomalies |
View an overview of recent failed calls. |
Open Logs to view the corresponding request details. |
The dashboard shows the current overview. Continue to Logs to locate an individual call, or to Usage to verify cost and Token consumption.
View usage and cost
Open Usage. The page provides Today, This week, This month, and custom time ranges by default. After selecting a range, review Token consumption, cost, requests, success rate, and average Tokens per request for that range.
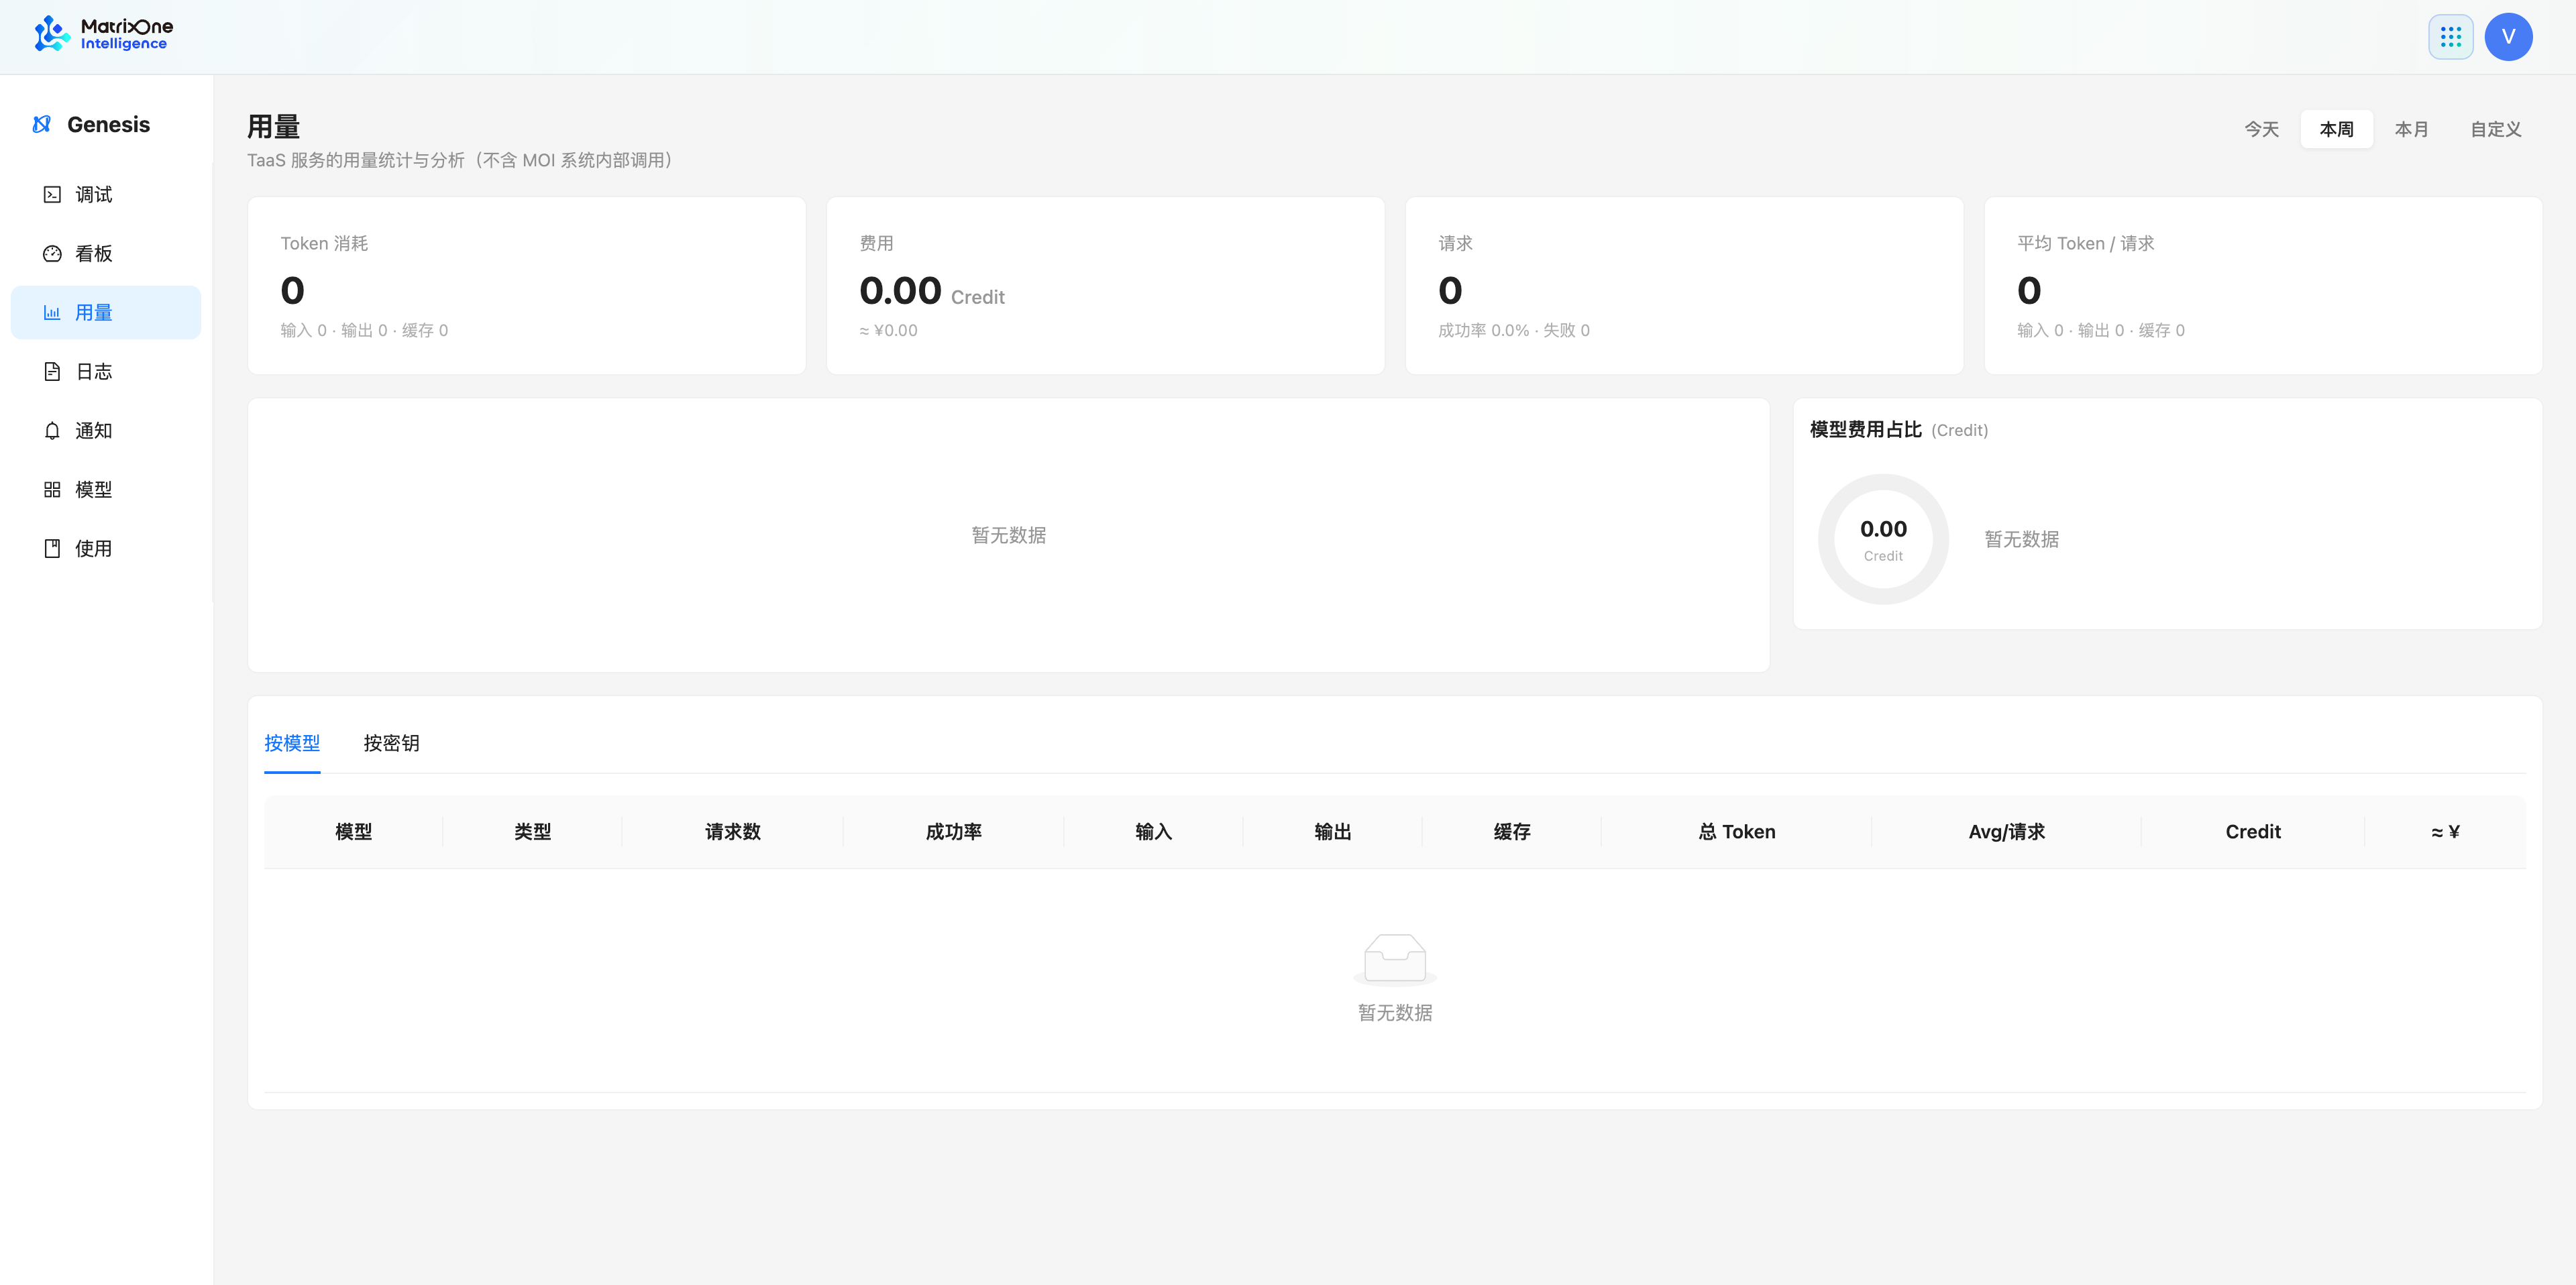
Select Today, This week, This month, or open Custom to set a time range.
Review the summary cards at the top to confirm Tokens, cost, requests, and success rate.
Use the trend chart to view changes in the selected time range.
In the By model or By key tab, view grouped statistics to locate models or call credentials with higher consumption.
In the By key view, the table aggregates requests, success rate, input/output/cache Tokens, total Tokens, average Tokens per request, and cost by call credential. Use it to distinguish the consumption of different applications or automated tasks. A credential name is not a complete key and should not replace application request records.
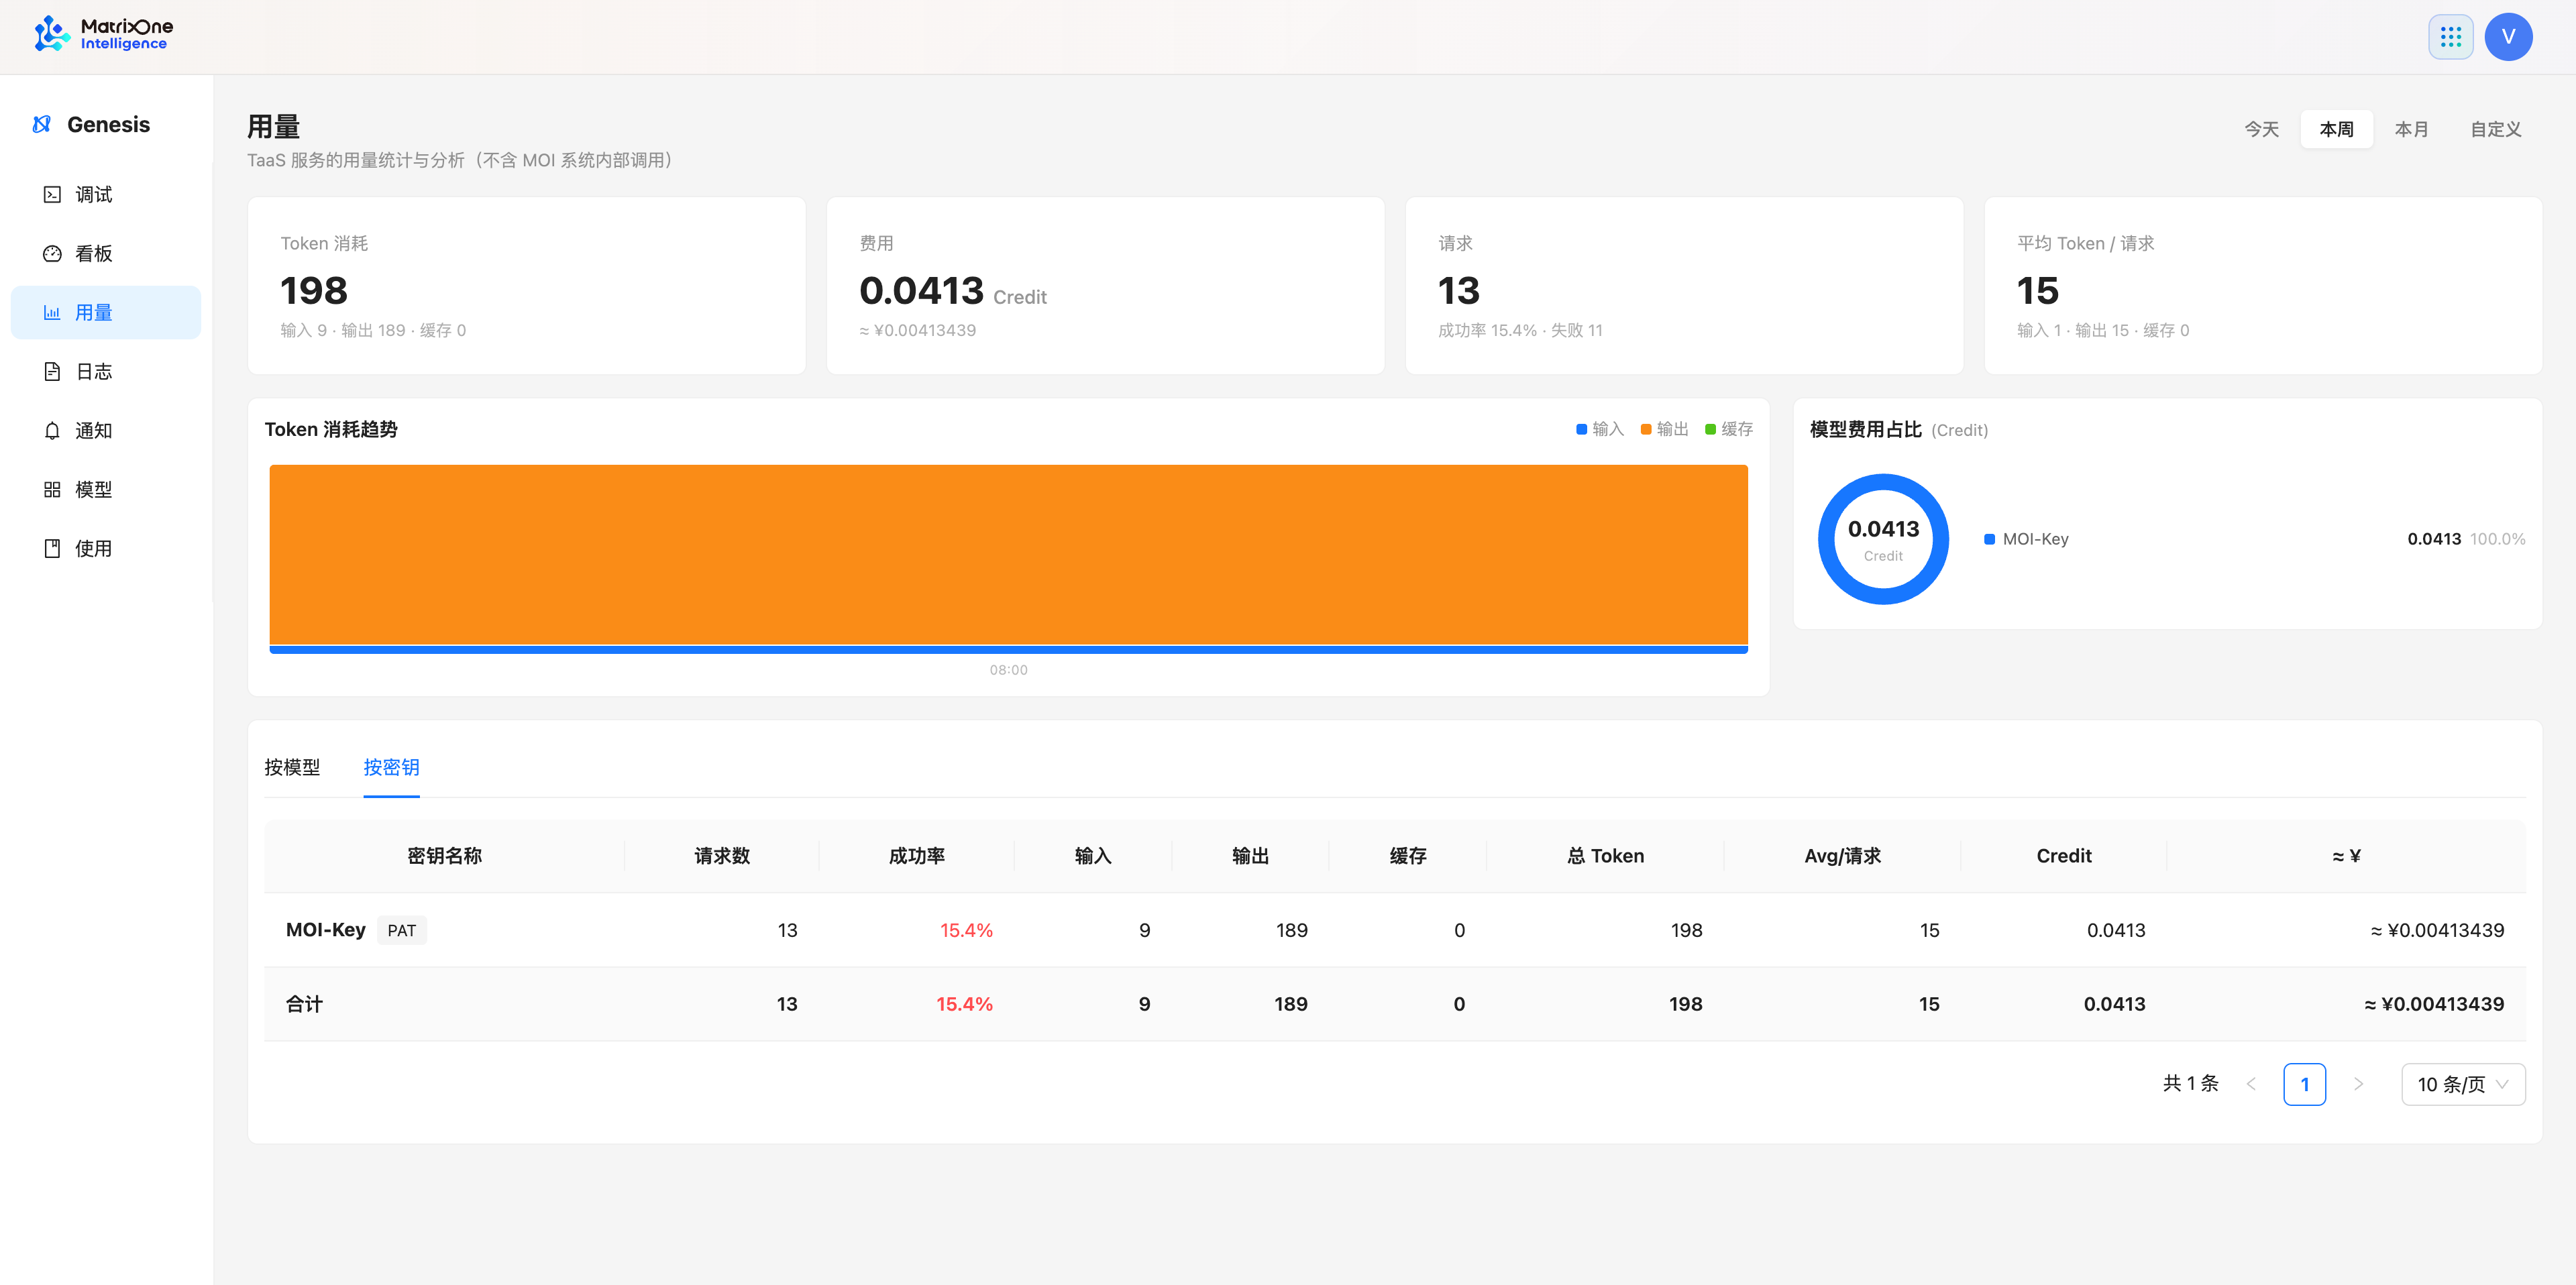
Cost on the page is shown in Credits. For billing rules, see Genesis usage and billing.
Locate an individual call through logs
Open Logs in the left navigation. First select a time range. To narrow the result, filter by call credential or source IP. The log list shows call time, model, call credential, input/output Tokens, cache Tokens, duration, and status.
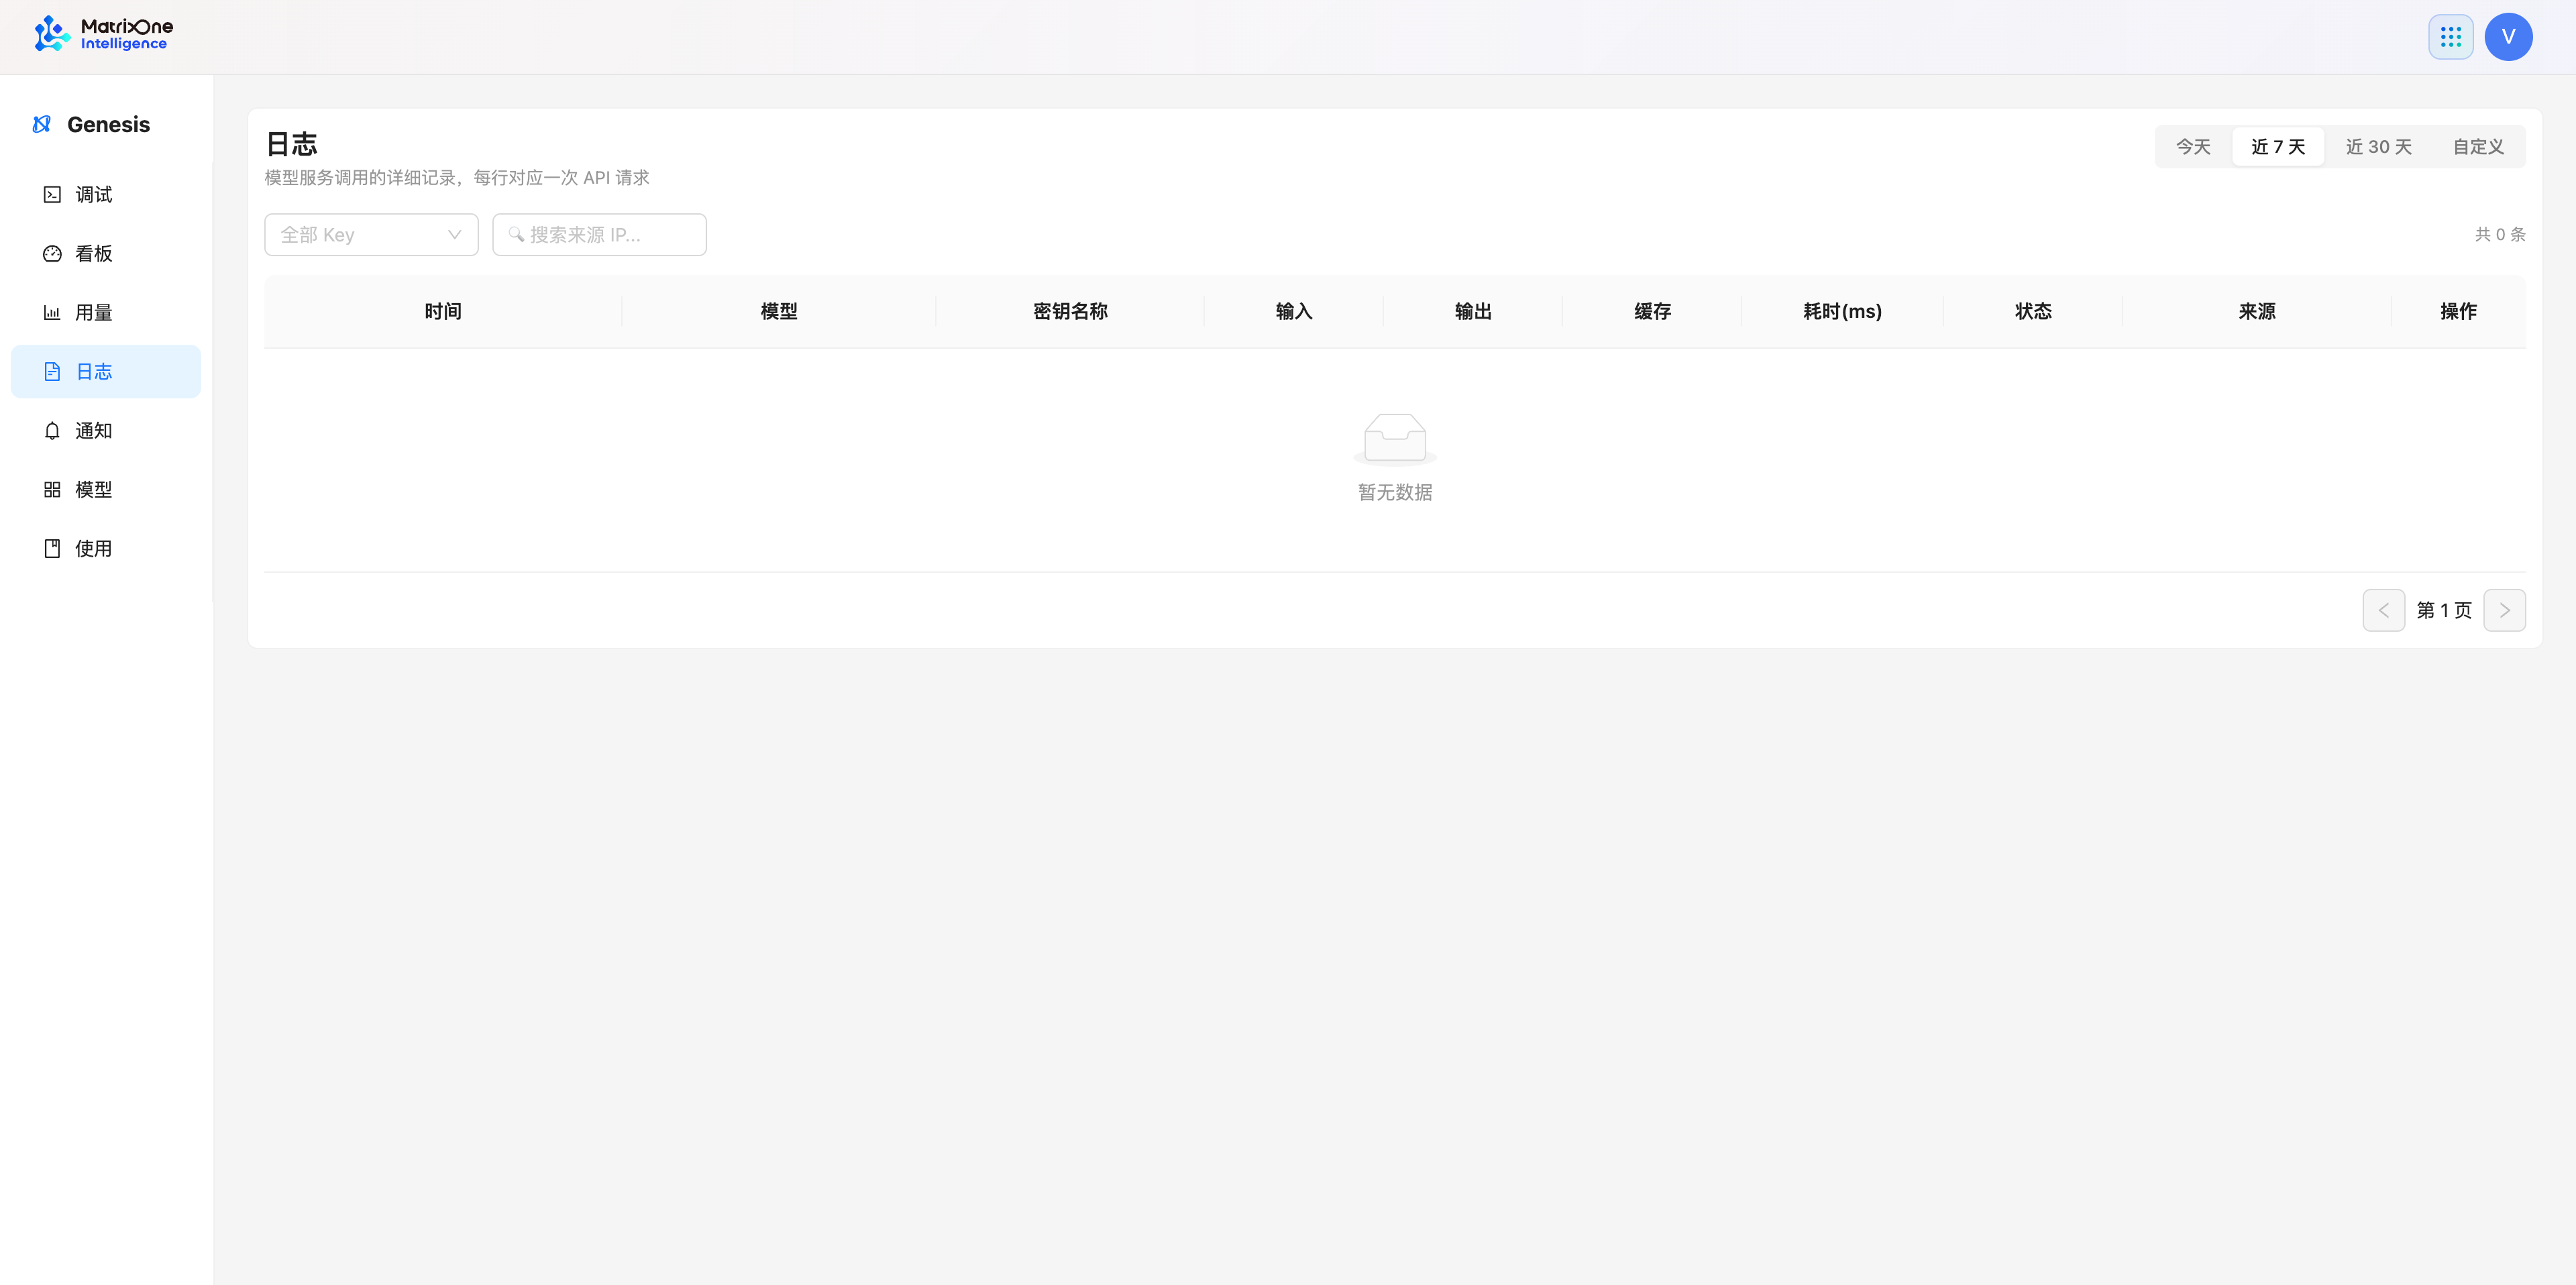
Use the time range to locate the period in which the failure occurred.
Filter by call credential or source IP to narrow the results.
Find a record with an abnormal status or duration, then click Details.
In the details, view the request, response, error information, and call metadata shown by the page.
Logs are intended to locate a single call. Their request or response content can include business data. Grant access only to authorized personnel, and handle exported information appropriately after troubleshooting.
View and configure notifications
Open Notifications in the left navigation. The page uses Notification list, Notification channels, and Notification settings for events that have occurred, delivery methods, and trigger rules respectively.
View the notification list
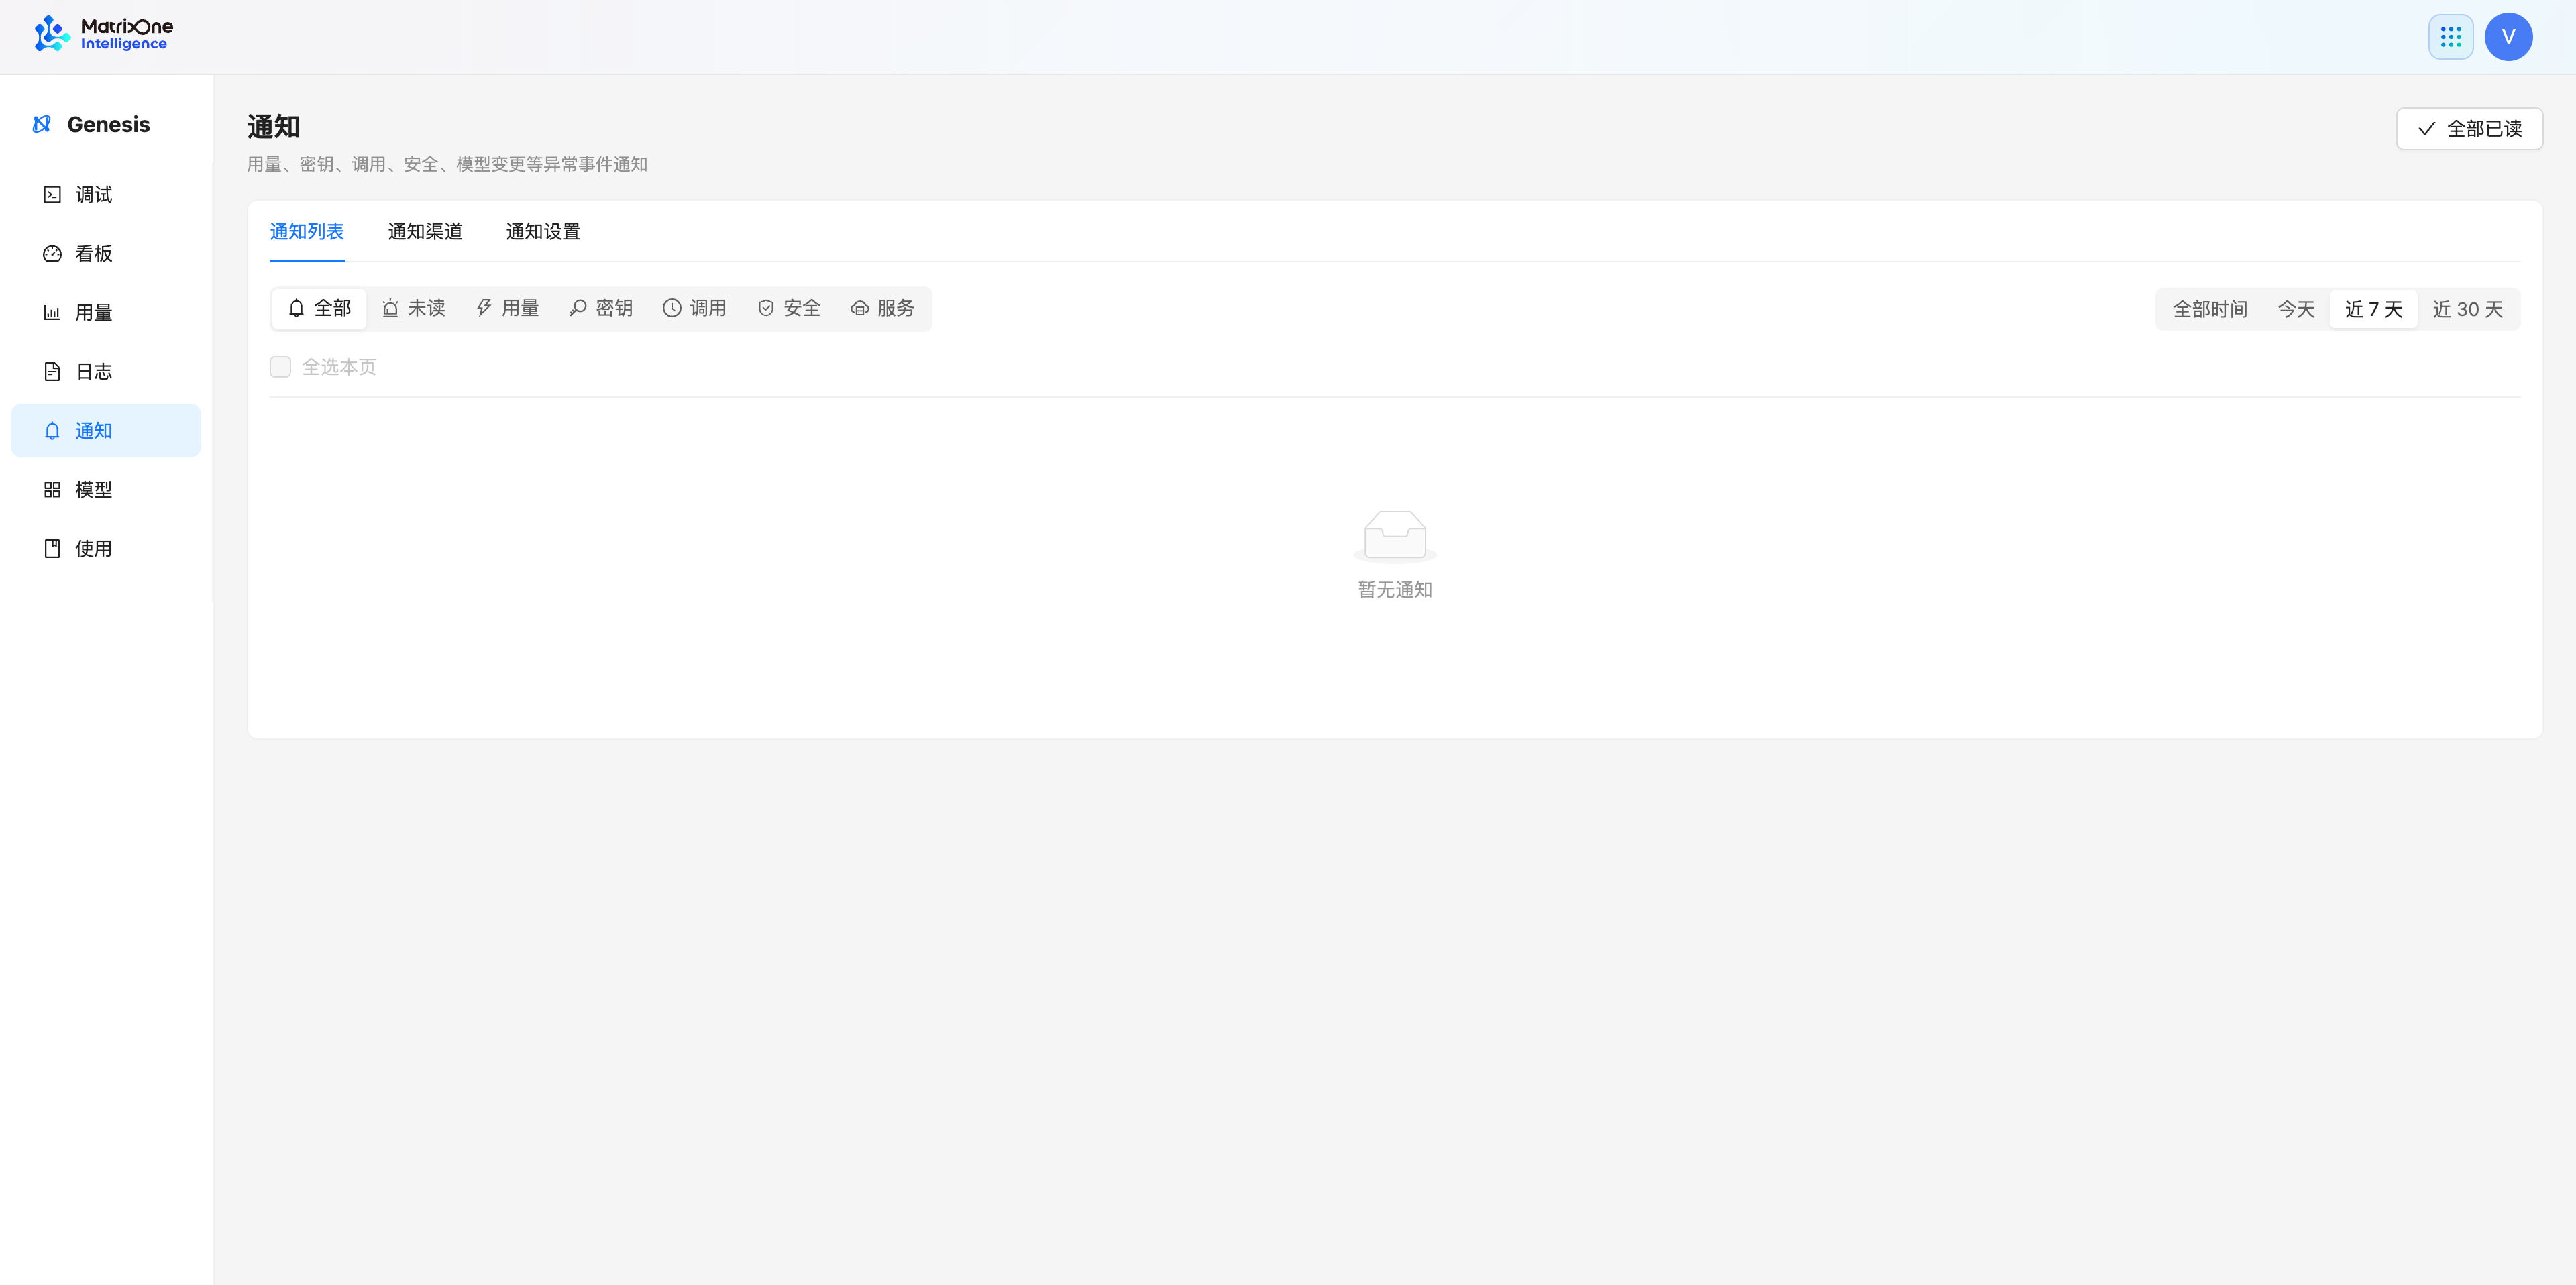
In Notification list, you can filter by unread status and by usage, key, invocation, security, or service category, and select a time range. After handling an event, you can mark the notification as read.
Configure notification channels
Open Notification channels and select the priorities you need to receive. The current page provides in-console notifications, email, and Webhook: in-console notifications can receive events with different priorities; email can configure recipients and send a test; Webhook can add an endpoint.
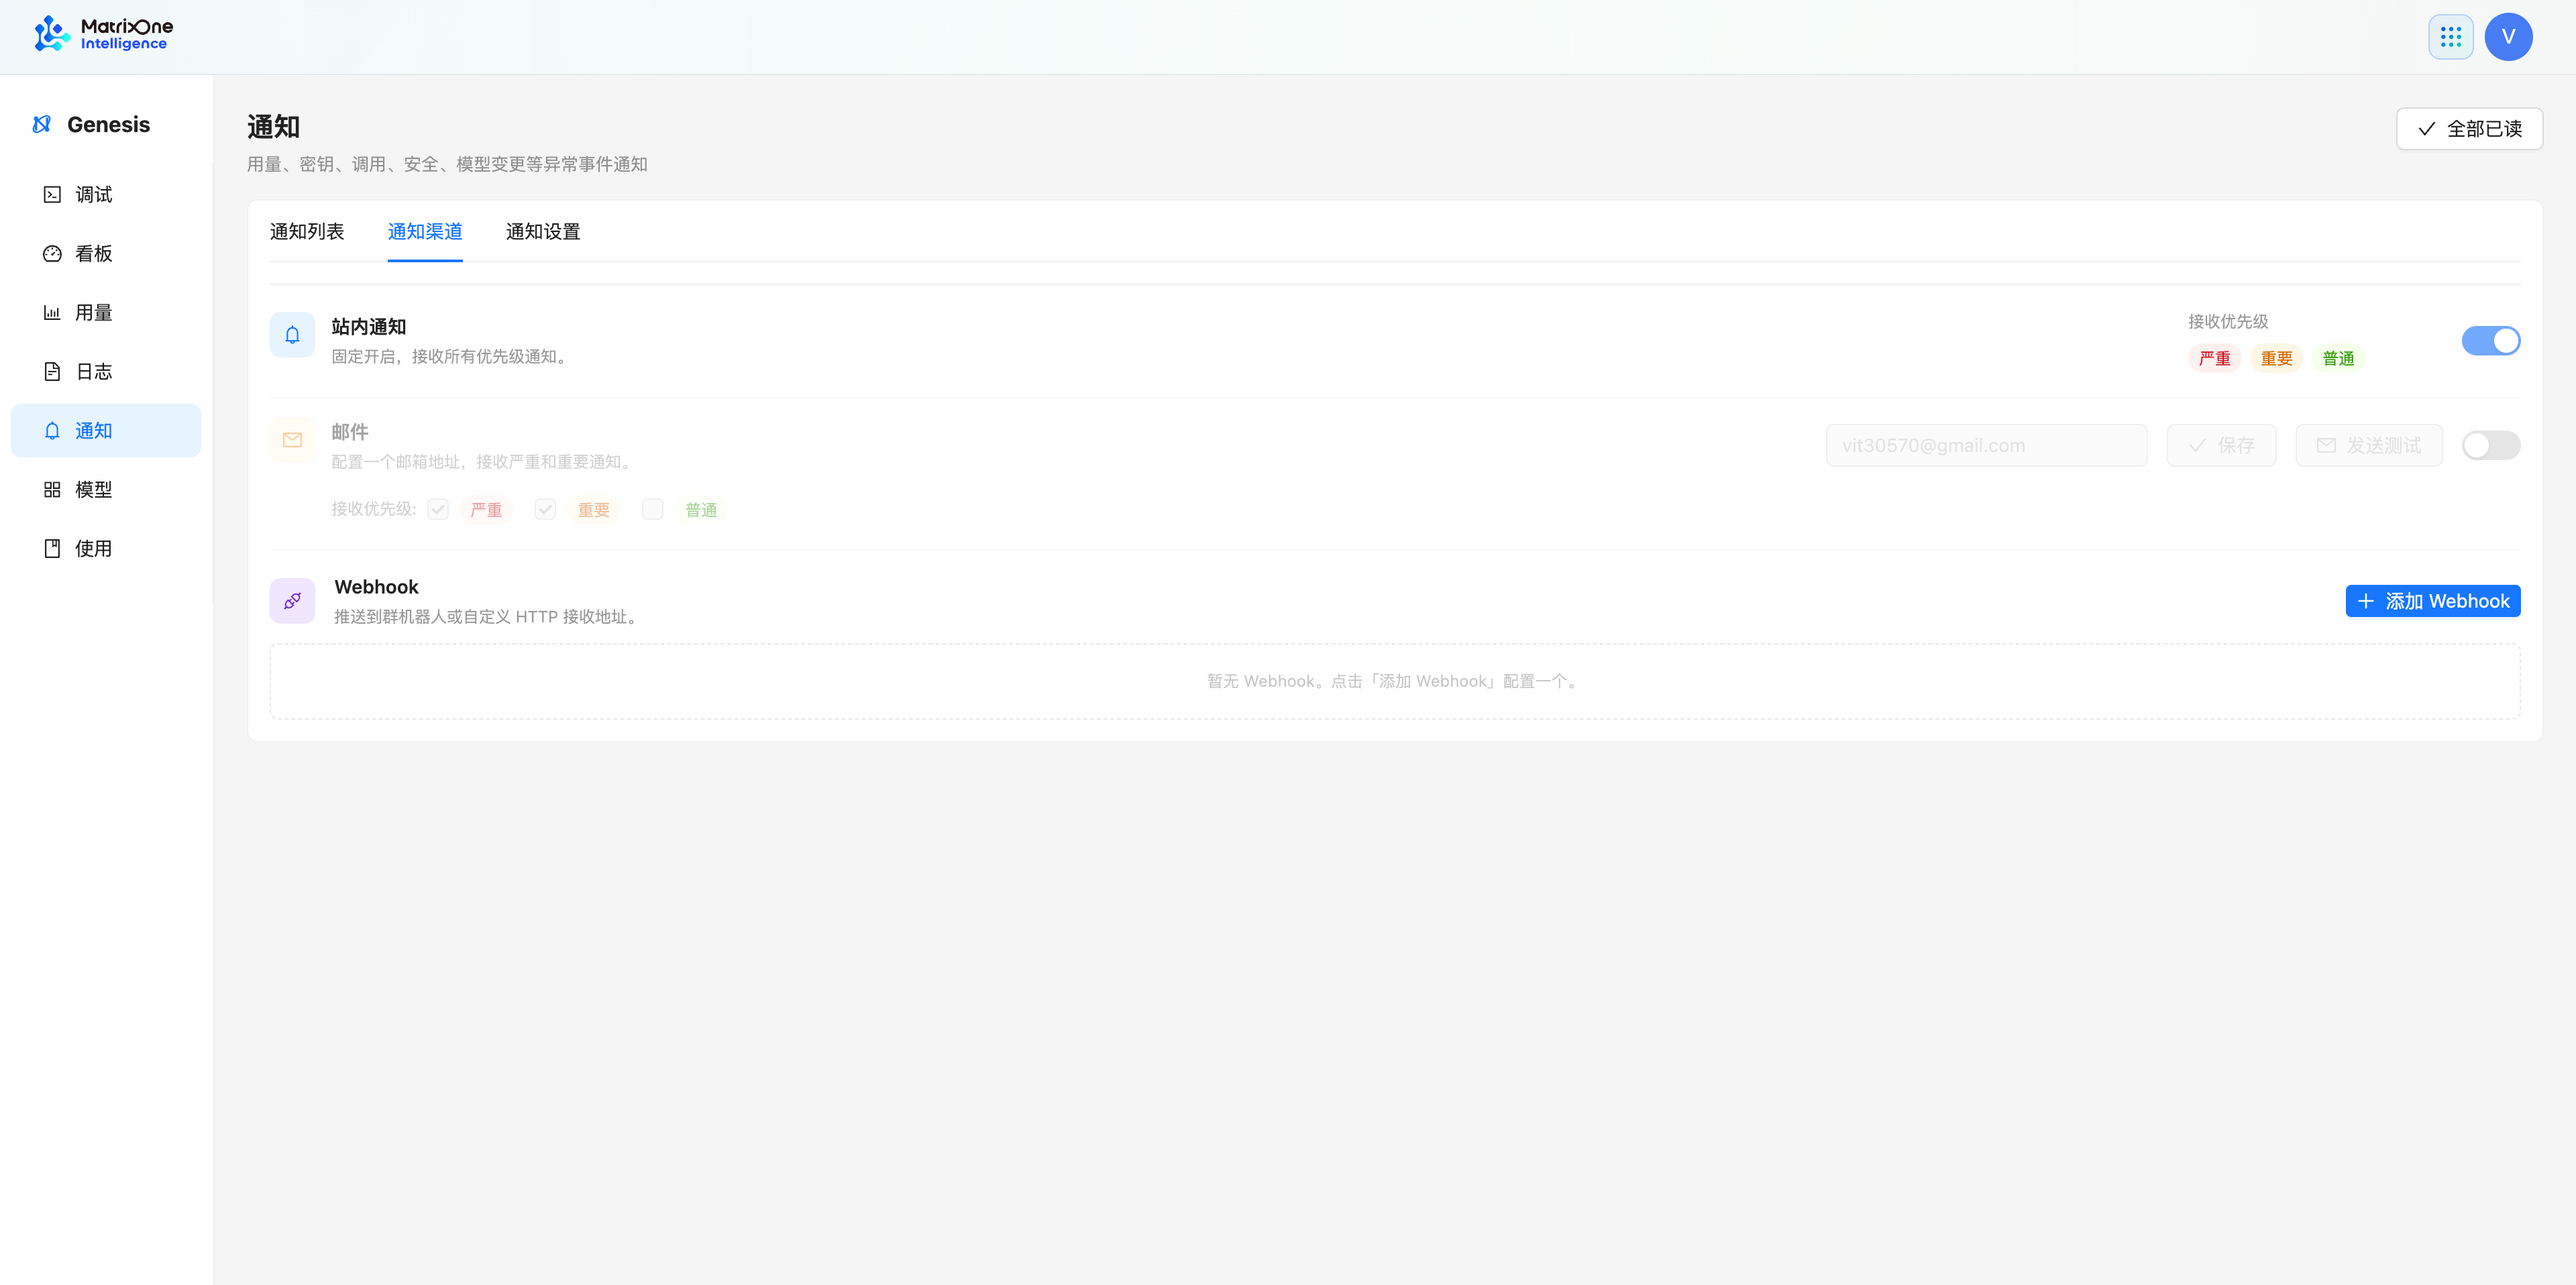
Before configuring email or Webhook, confirm that the recipient address belongs to the intended recipient. After configuration, use the test function provided by the page to validate the receiver. Do not write complete Webhook URLs, signing keys, or email addresses to application logs or screenshots.
Adjust notification settings
In Notification settings, configure priority, trigger threshold, and enabled status for each notification item. The rules available for usage, keys, invocations, security, and service events depend on what the page currently shows.
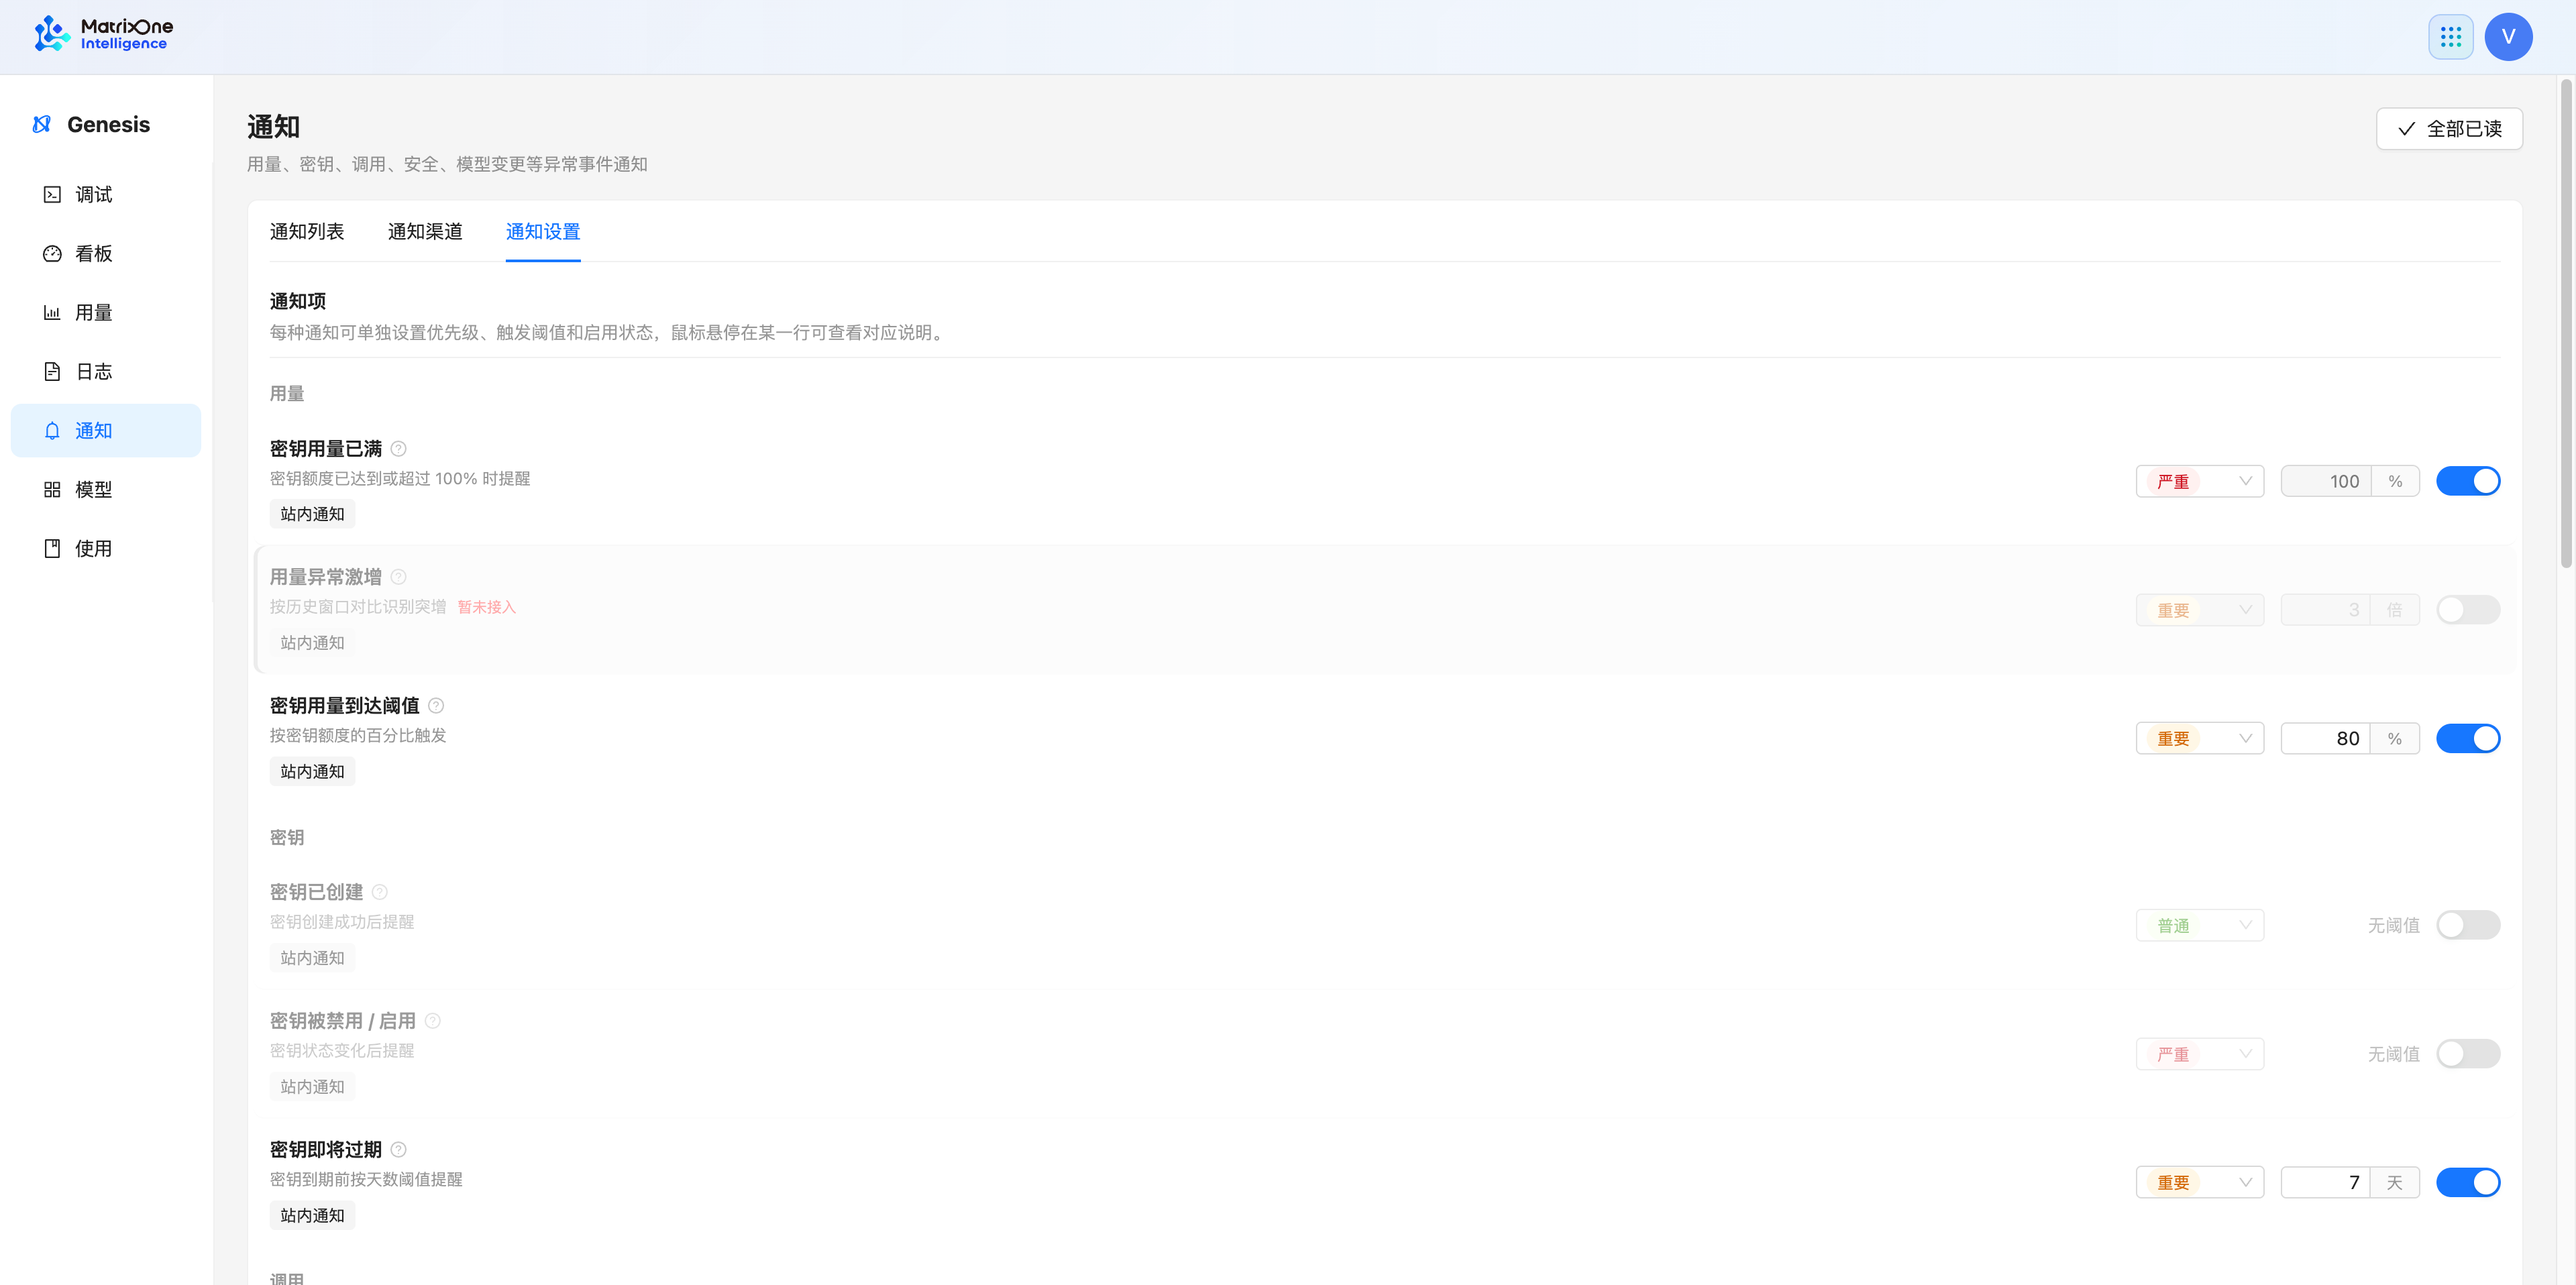
Prioritize notifications for invocation failures, credential expiration, and usage thresholds. Set thresholds that match the consumption your business can tolerate and the time available to respond. Then return to Notification list to check that the relevant events are received.
Recommended troubleshooting path
Use Dashboard to determine whether the issue affects one model, current traffic, or the overall success rate.
Use Logs to find abnormal calls in the relevant time period, then review their status and error information in the details.
Use Usage to confirm the scope of impact and resource consumption by model or call credential.
For continued monitoring, open Notifications to check relevant rules and delivery channels.