SQL Query History
This article will introduce the query history module to help you easily view historical SQL query records, identify potentially risky SQL statements and exceptions and other audit content.
SQL query record
-
Log in to the MatrixOne Intelligence instance management platform. Select the target instance and clickConnect through cloud platform to access the MatrixOne Intelligence database management platform.
-
In the MatrixOne Intelligence database management platform, find theQuery History module in the menu bar on the left. Click to enter the SQL query history page.
This page displays the query history in the last two hours by default. You can set specific filter conditions, such as SQL type, time, and more filter conditions, such as SQL text, duration, database, etc., to narrow the scope of the query and quickly locate SQL query records under specific conditions. Click theSearch button to filter out a list of query records that meet specific criteria.
Note
When SQL text is turned on as a filter, be careful to be case sensitive.
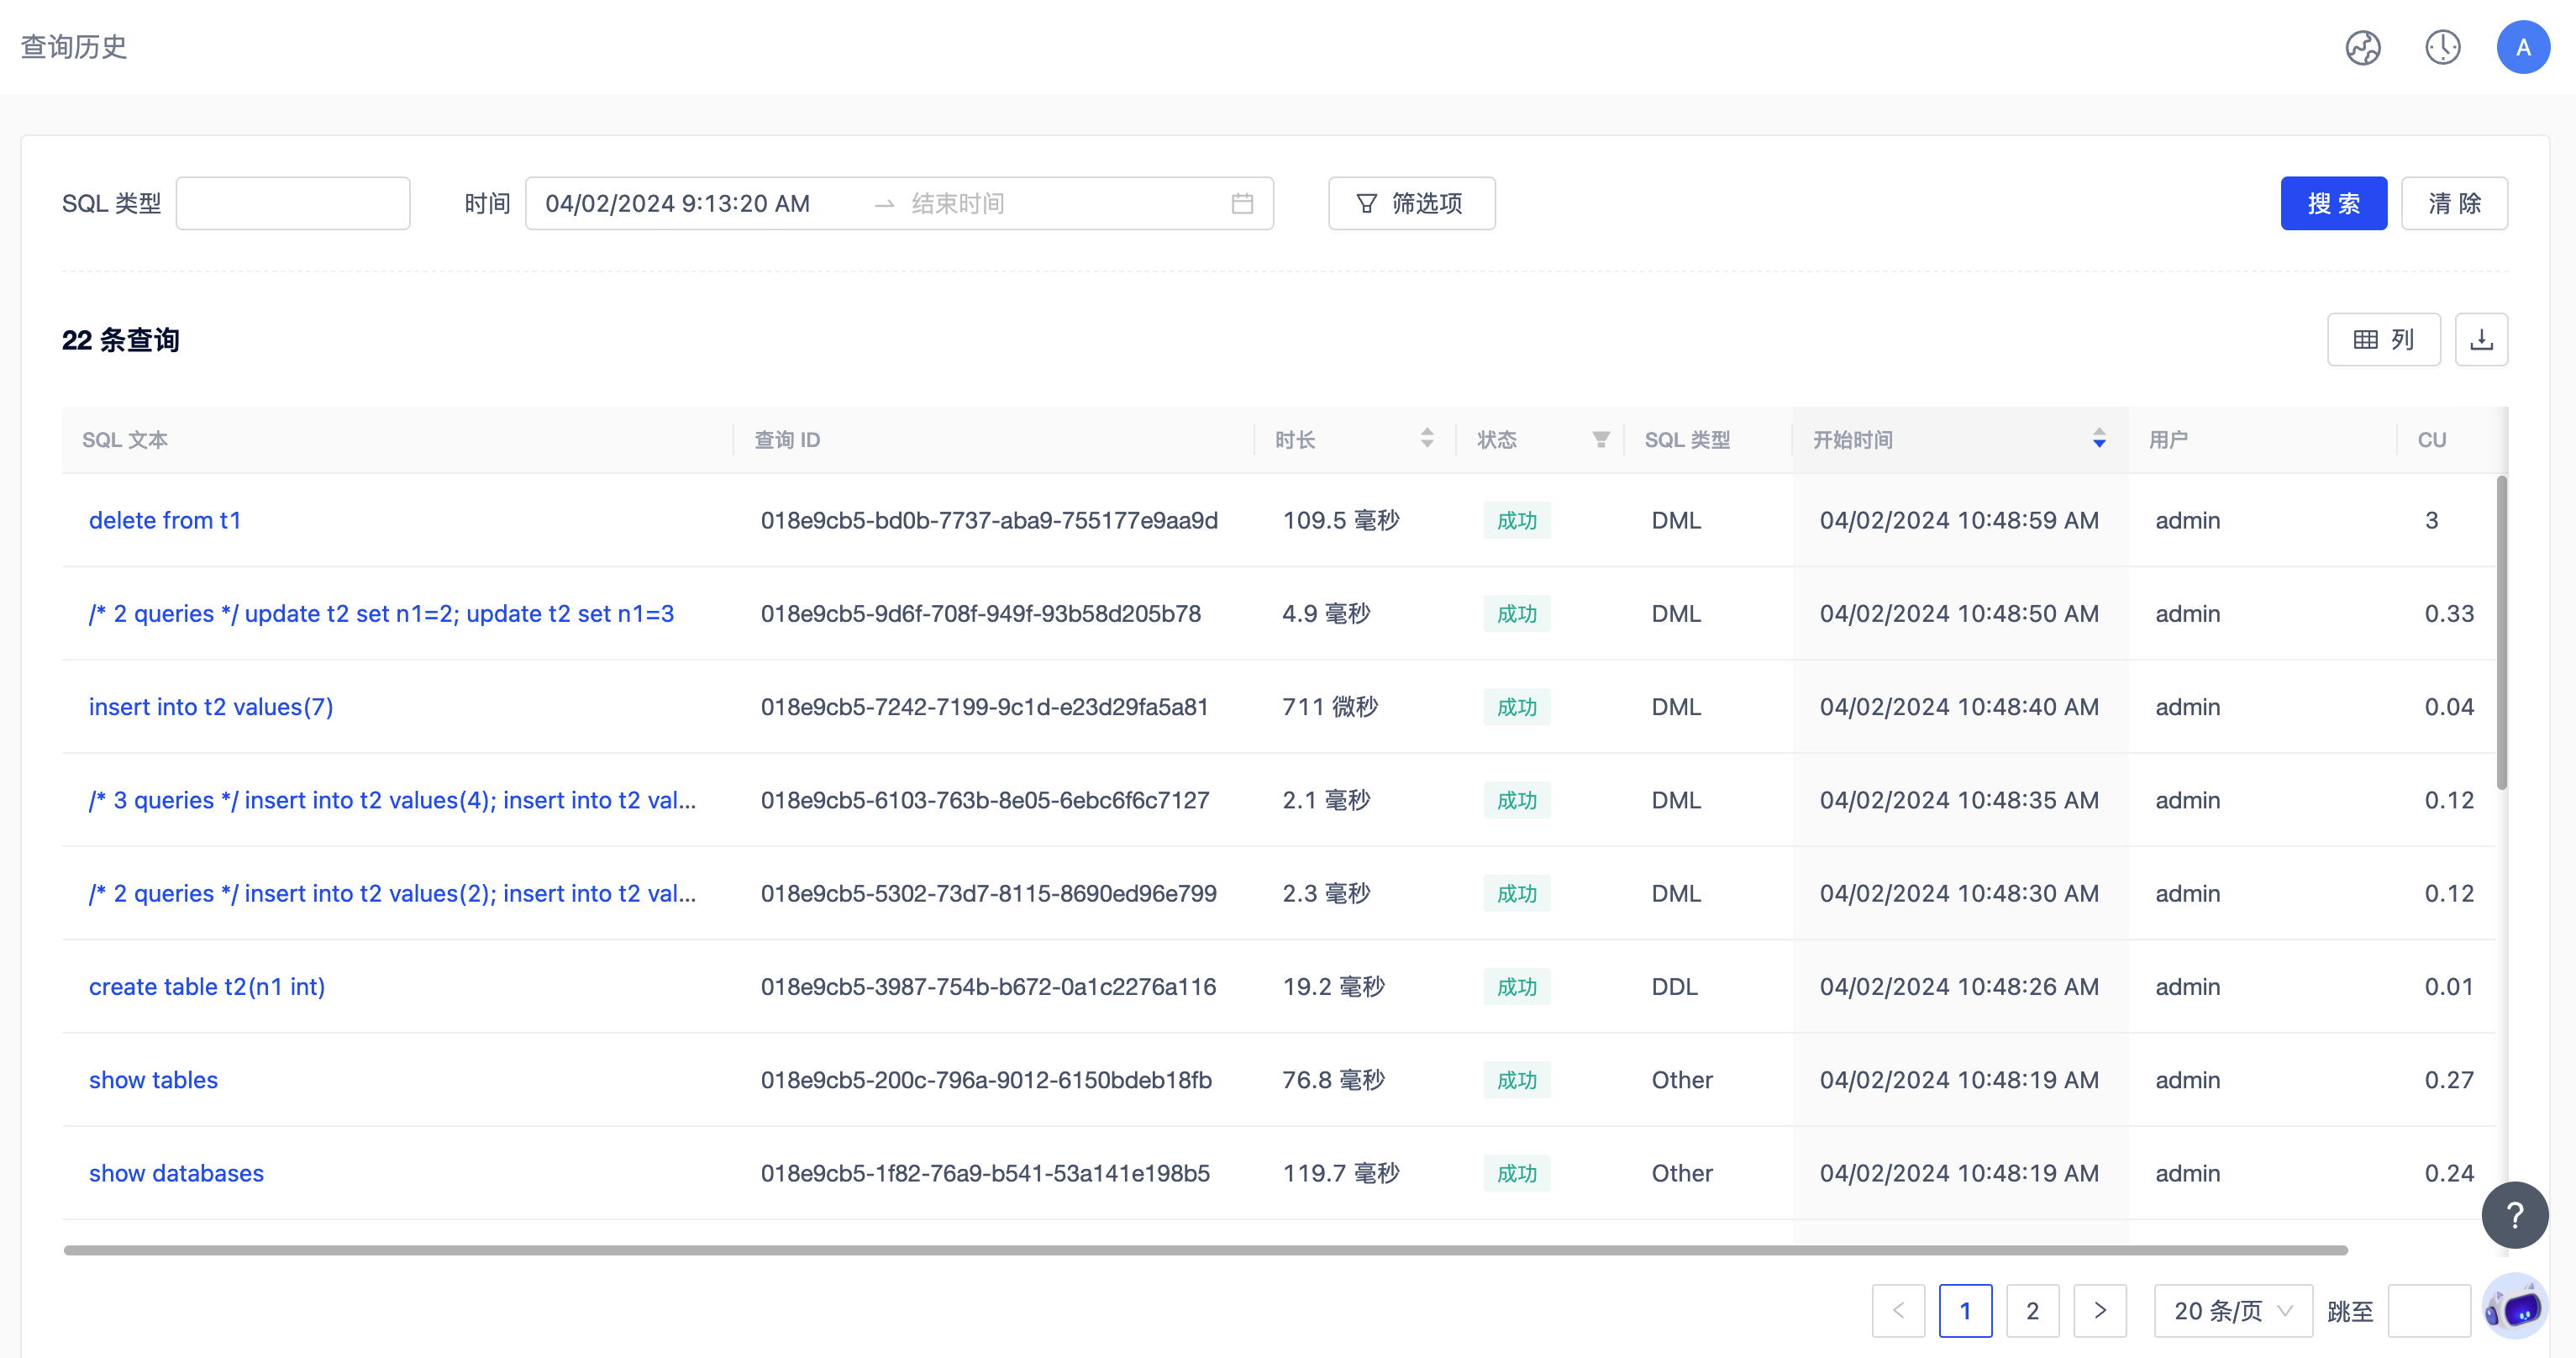
In theSQL text column you can see that some SQL will have the "/ x queries/" flag in front of it, because the table information recording the query history is large. To improve query speed, we aggregate records with ultra-lightweight tp sqls according to the following rules:
- The aggregation period is 5s
- Conditions for aggregating SQL
- Insert, Update, Delete, Execute, Select statements with time less than 200 ms
- response_at (response time) sql during aggregation cycle
- sql_source_type: internal_sql (internal SQL request for system), cloud_nonuser_sql (cloud platform non-user statement), external_sql (external statement)
Among them, the fieldduration is the total response time after SQL statement aggregation. "/ x queries/" refers to the number of aggregated fields.
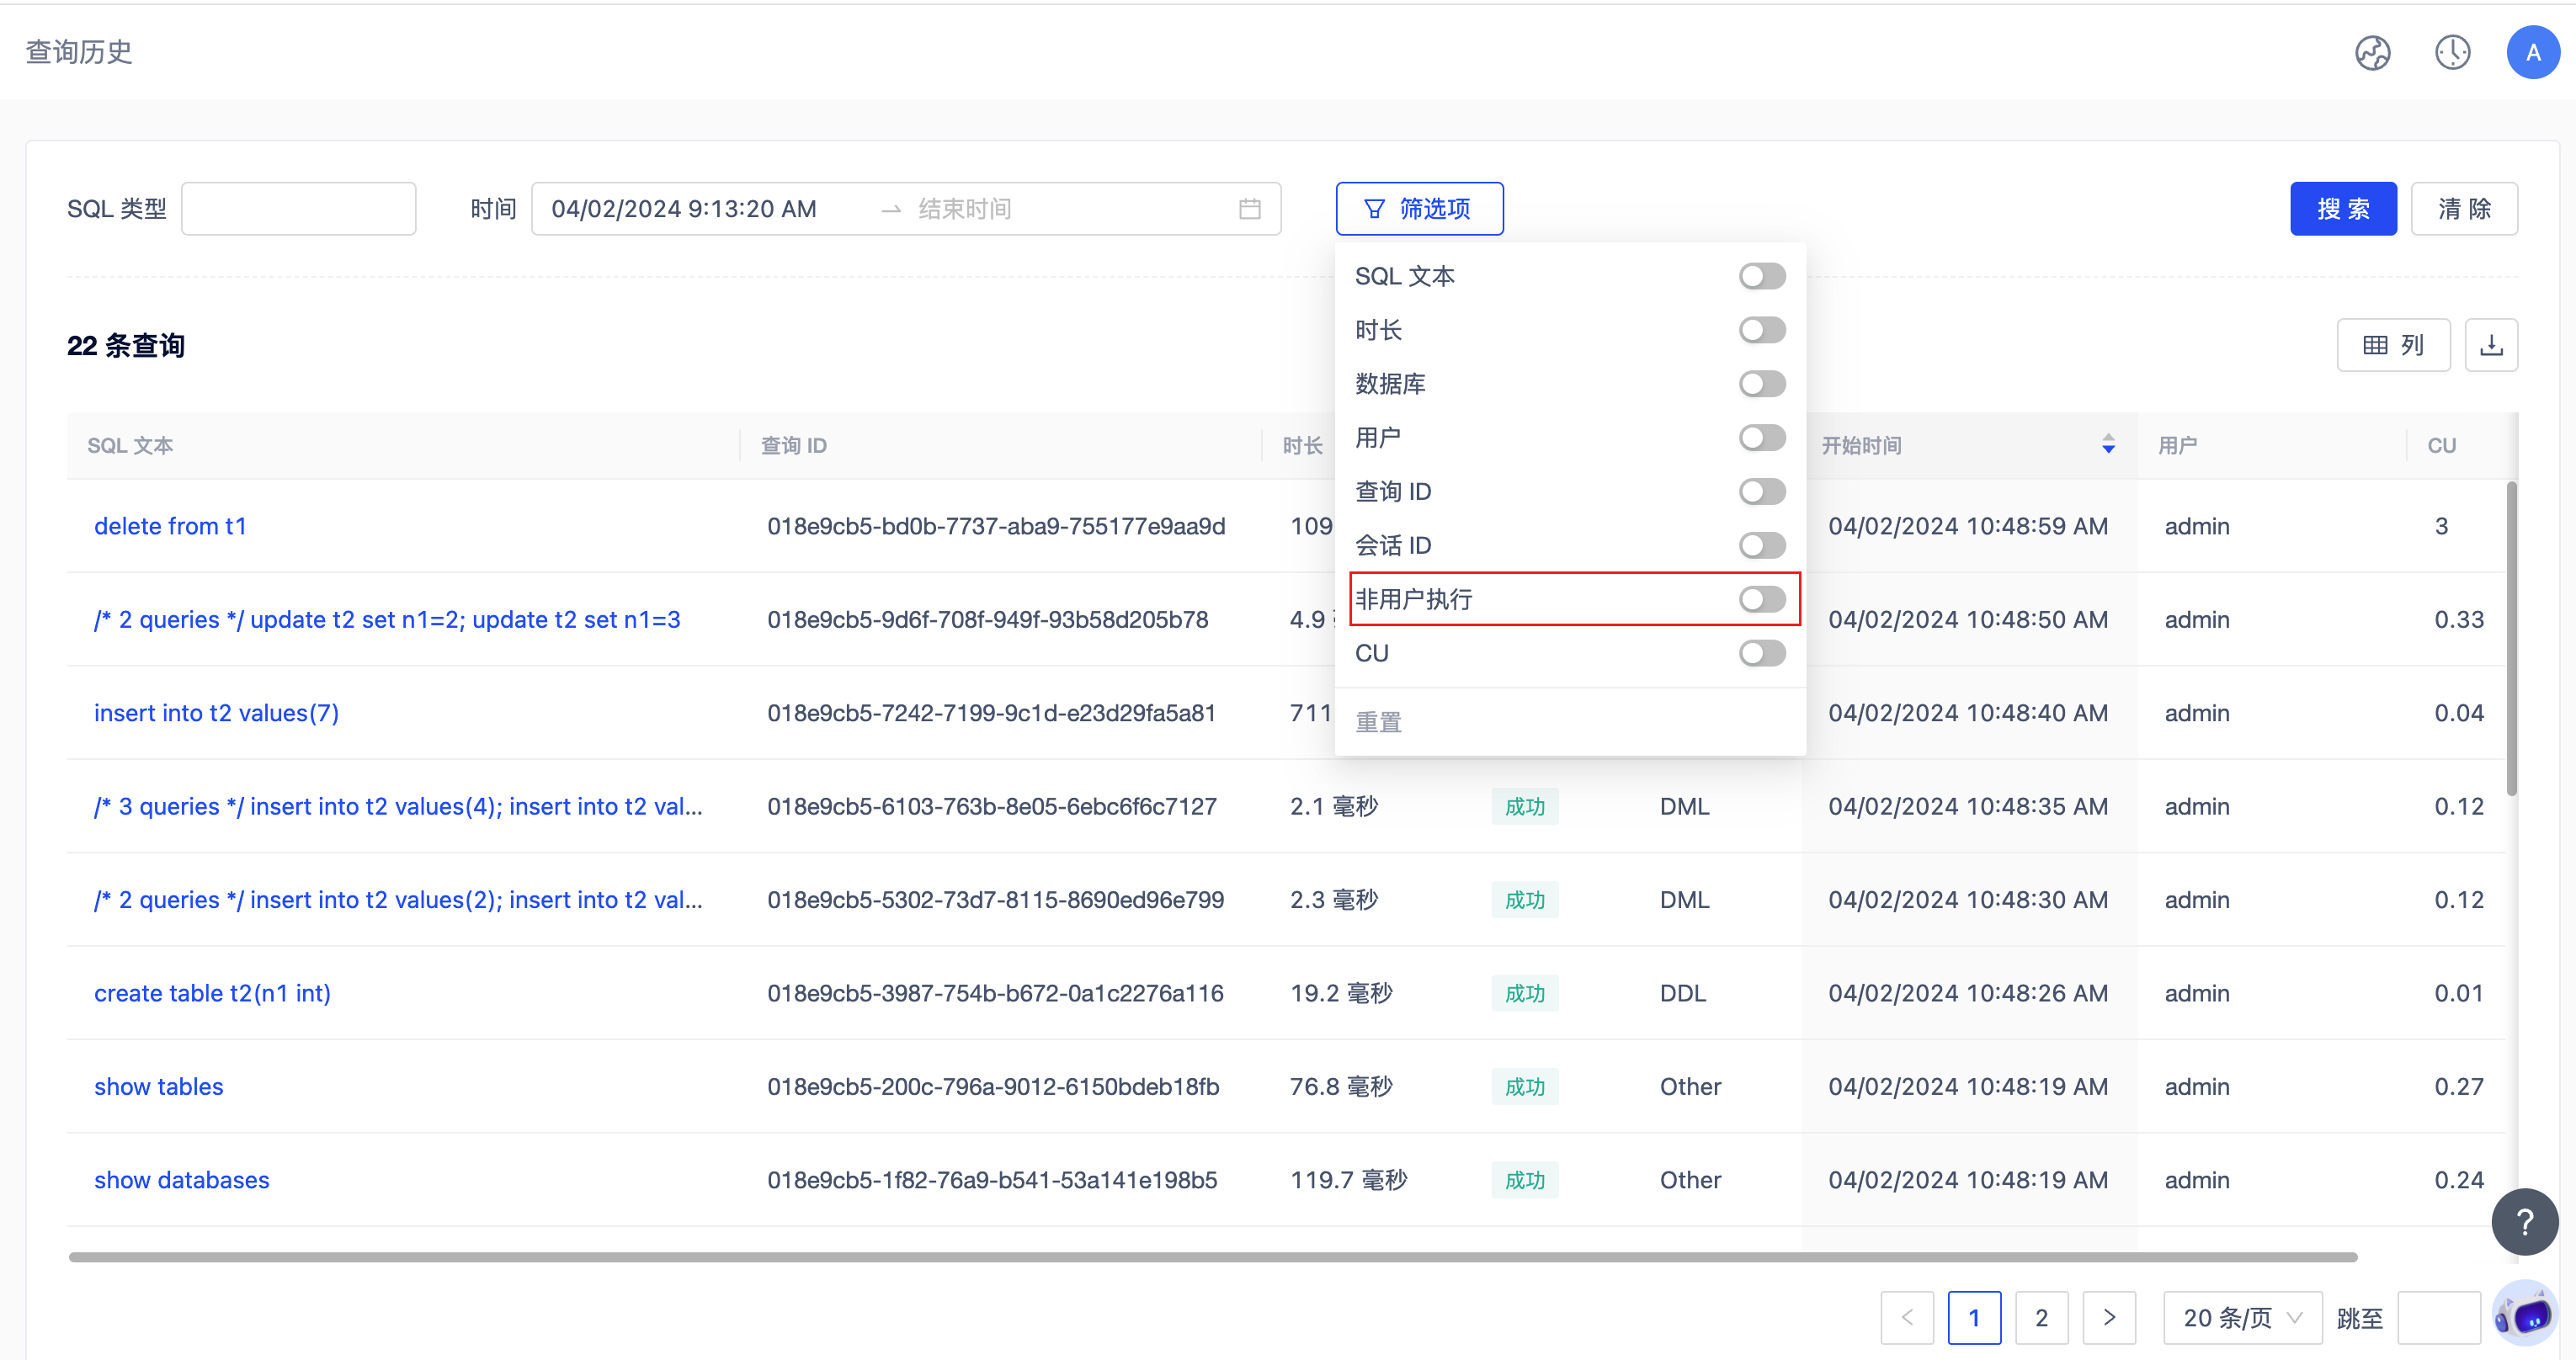
As MatrixOne's cloud database management platform, MatrixOne Intelligence provides users with an interface display of database information. The information obtained by any operation on the instance platform is obtained from the database, which means that all operations on the platform will generate SQL and consume CU. However, considering that users may be more concerned about business SQL, in order to give users a better observation experience, non-user-operated SQL on the platform (except SQL executed by SQL Editor) is not displayed by default in the query history. For production examples, CUs generated by non-user operations on the platform are also charged. You can enable the non-user execution option in the filter option to view the details of this part of SQL.
SQL Query Details
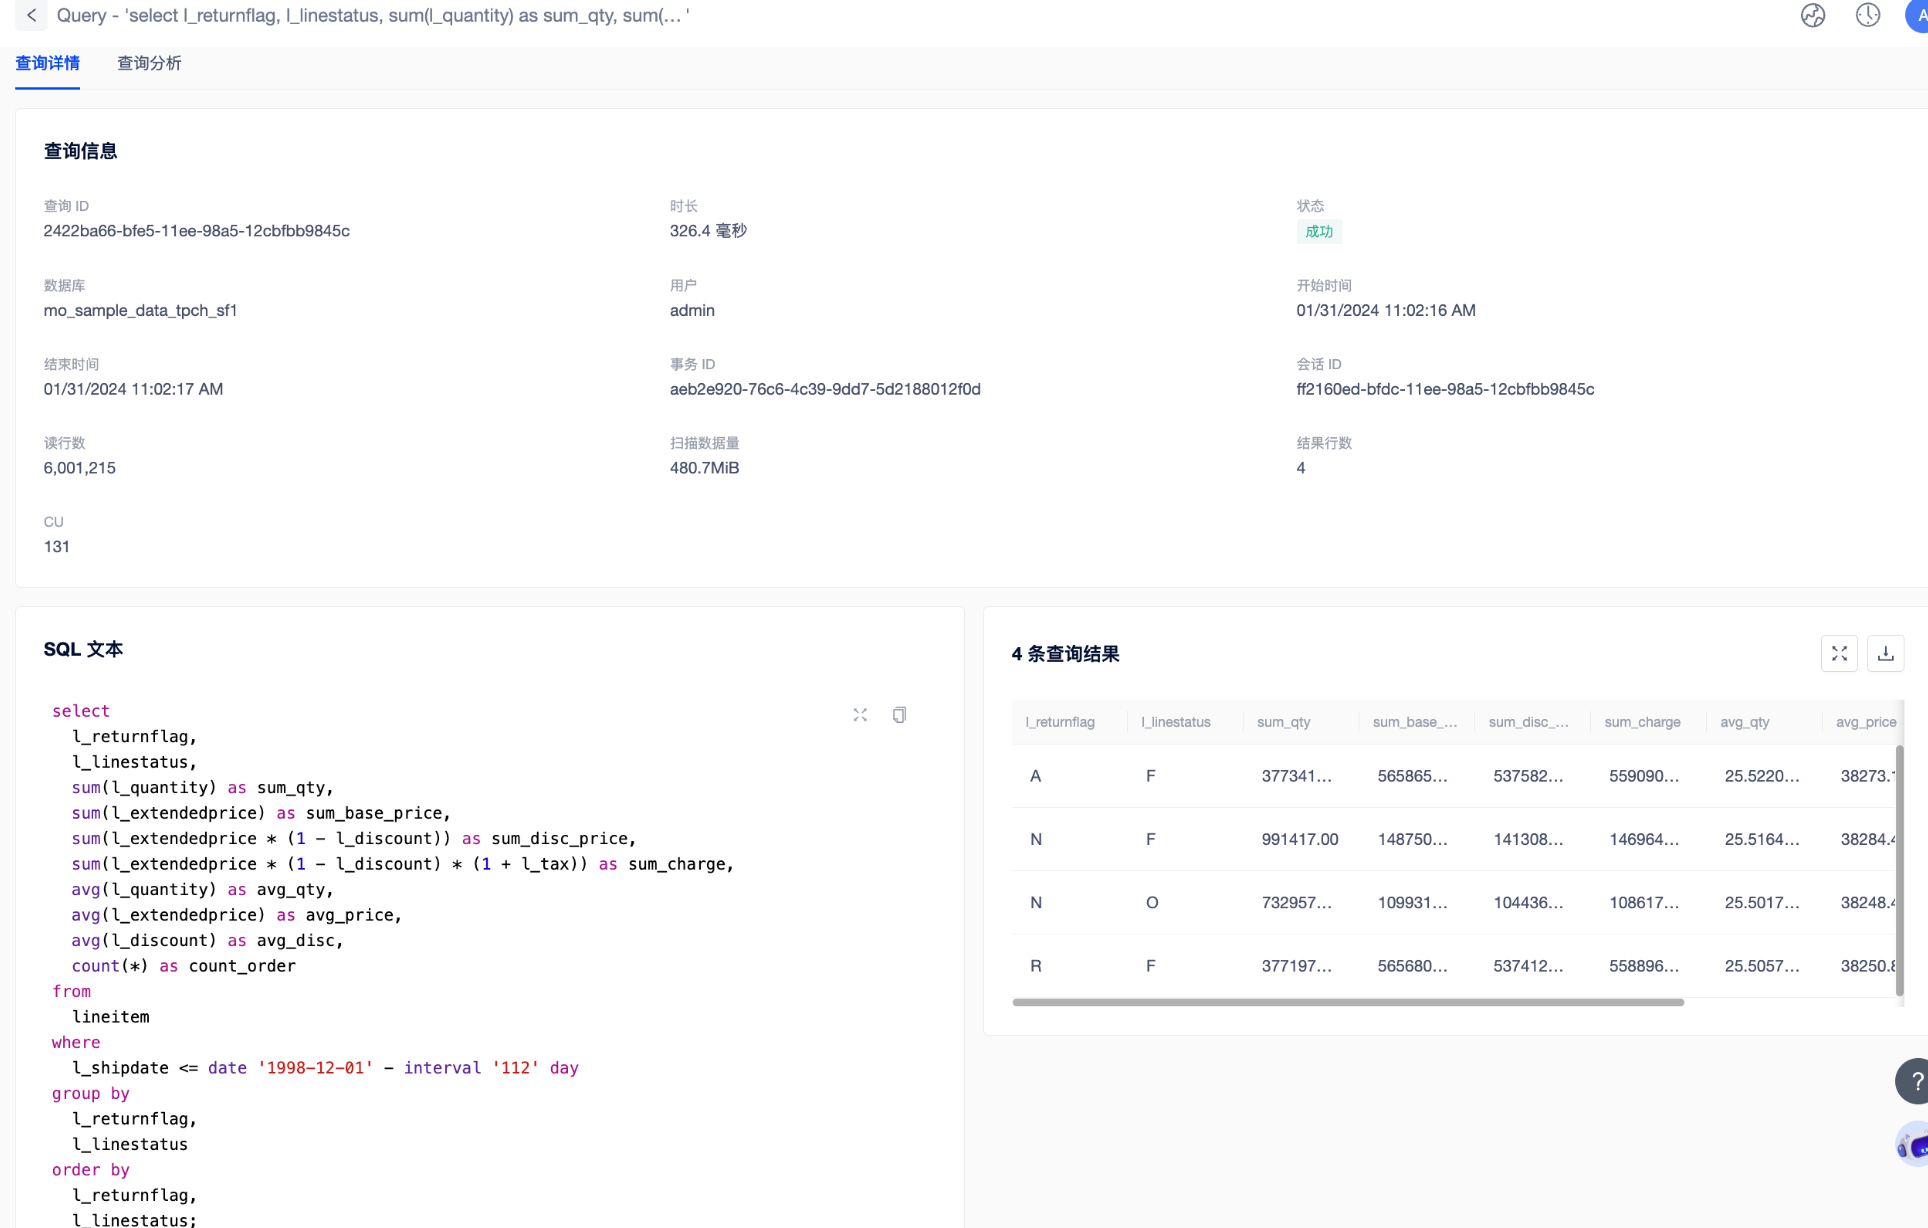
In the list, click the SQL text content to enter the SQL query details page. On this page, you can view detailed information such as execution time, start and end time, transaction ID, session ID, CU consumption, SQL query statement content, etc. at the same time, you can also view the query results of specific SQL queries and click theDownload button to export the complete query results.
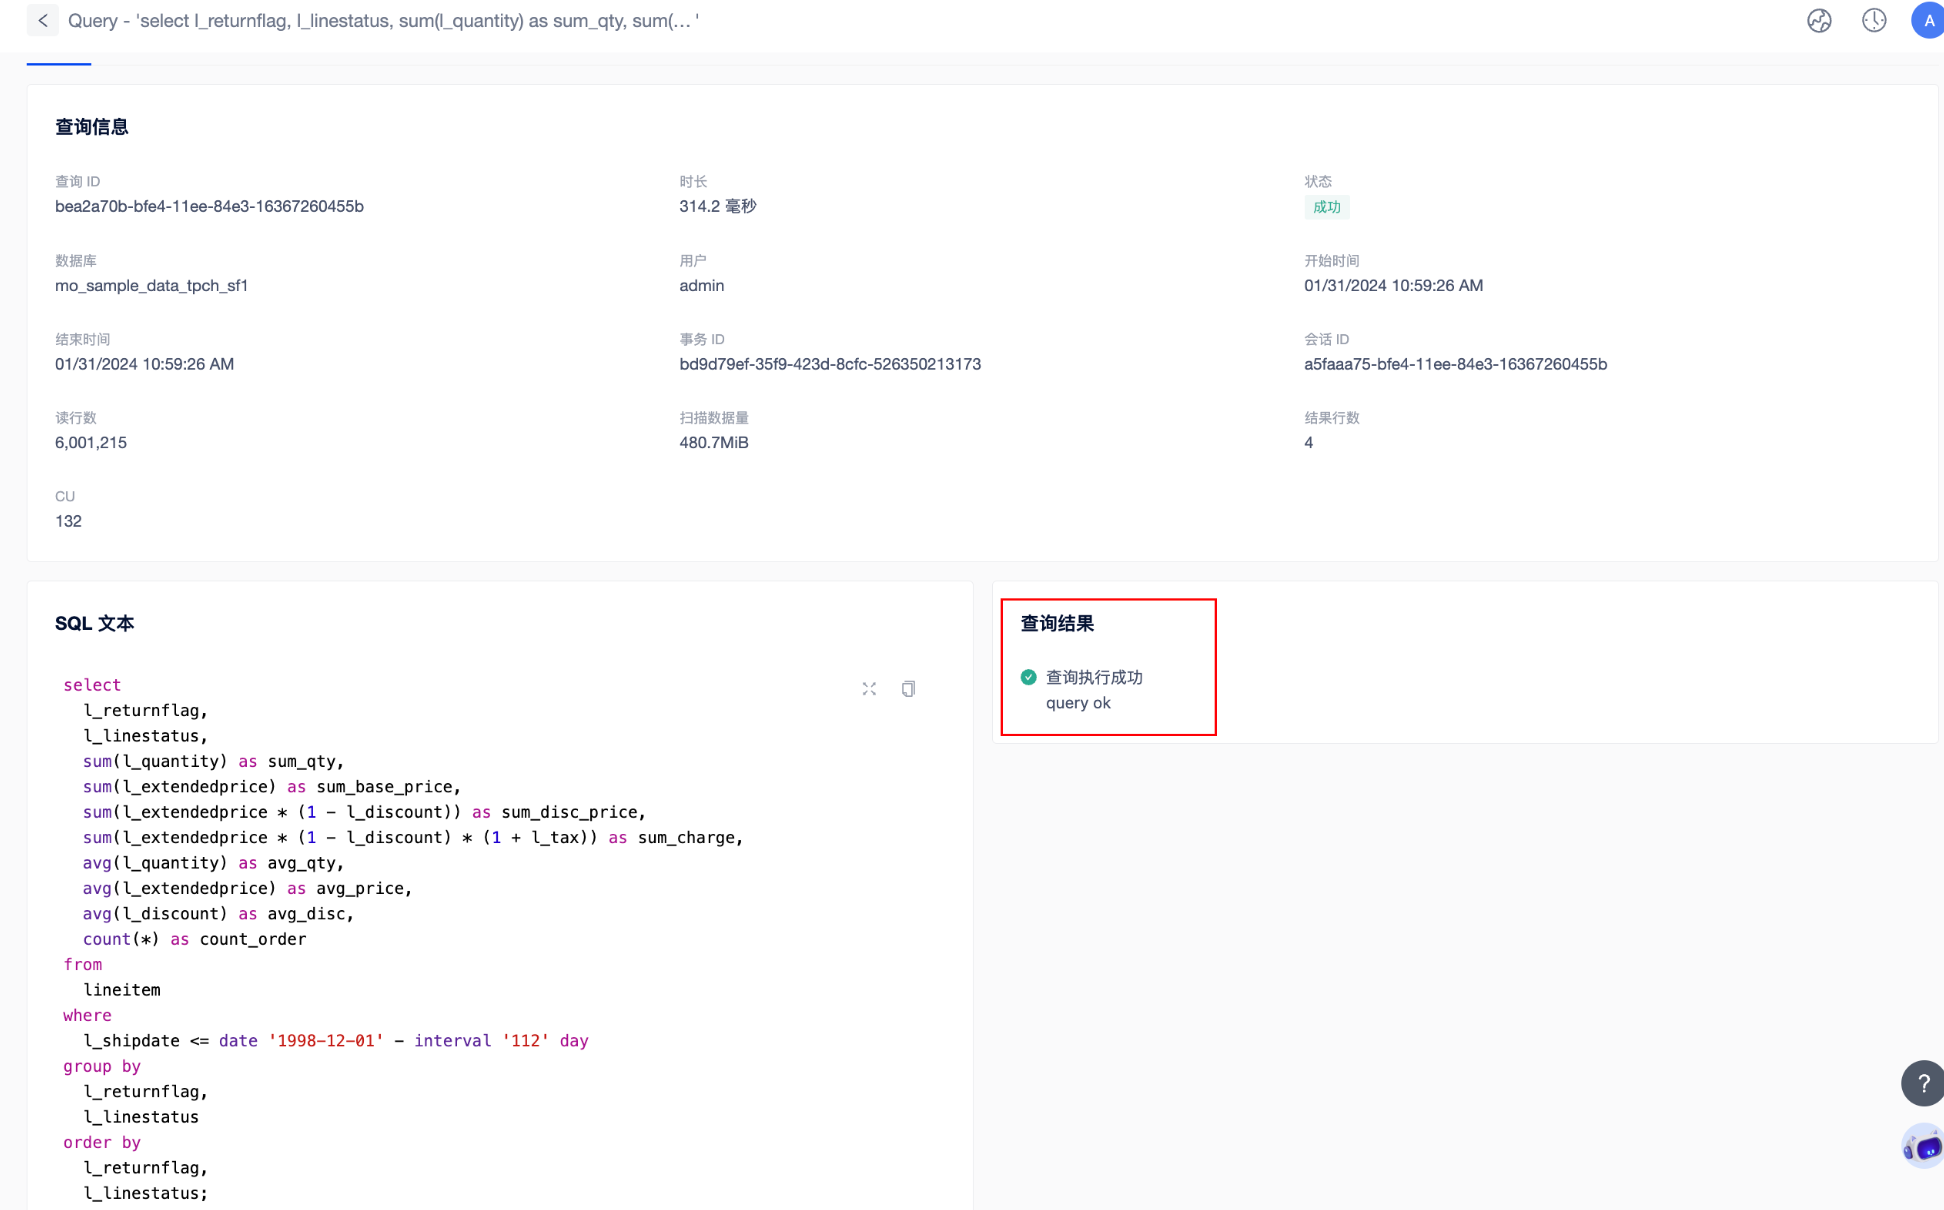
It should be noted that for SELECT statements not executed on the platformSQL editor, only the query results of SELECT statements starting with /* cloud_user */ and /* save_result */ are saved. When the above hint is not included, Query will not display the detailed query results, as shown in the figure below:
If you want to know more about MatrixOne's support for saving query results, please check [Save query results support] (https://docs.matrixorigin.cn/v25.2.1.0/MatrixOne/Reference/Variable/system-variables/save_query_result/#_2).
Now you have learned how to access SQL query history, filter query records, and view detailed query information. This will help you monitor and audit SQL queries to ensure the proper functioning and security of your database.