Query Analysis
This document will guide users how to conduct online SQL query analysis through the built-in Query Profile of MatrixOne Intelligence. It can also be understood as the query analysis module is to create a visual module for explaining the detailed execution plan in the database, which shows the SQL execution plan to the user through visualization.
Note
Since the saving of the execution plan consumes some resources, considering that it is mainly used for analyzing and improving slow queries, the cloud platform only saves the execution plan of SQL with execution time greater than 1s.
What is an execution plan
Execution plan (also called query plan or explanation plan) is a specific step in a database to execute SQL statements, such as accessing data in tables through index or full table scans, how to implement connection queries and order of connections, etc.; Execution plan can tell you how the query will be executed or how it has been executed based on the detailed information of your table, column, index and conditions in the WHERE clause. You can execute queries to huge tables without reading all rows; you can execute joins involving multiple tables without comparing each combination of rows. If the performance of the SQL statement is not ideal, you should first check its execution plan. Like most mature database products, MatrixOne databases also provide this capability to analyze query performance.
The MatrixOne query optimizer selects the most efficient execution plan for the input SQL query statements through the execution plan. You can also see the inefficient parts of SQL code through execution plans.
Use EXPLAIN to query execution plan
Users can use EXPLAIN to view the execution plan of MatrixOne when executing a SQL statement.
EXPLAIN can be used in conjunction with SELECT, DELETE, INSERT, REPLACE, and UPDATE statements. When EXPLAINis used with an interpretable statement, MatrixOne explains how it will handle the statement, including information about how the table is joined and the order of the join. MatrixOne Intelligence does not currently support querying execution plans by using EXPLAIN in the SQL editor, but provides a visual interface ofQuery Analysisto show the execution plans to users. If the user wants to view the original information ofEXPLAIN`, he can execute it through the MySQL client to connect to an instance of MatrixOne Intelligence.
Note
When connecting to MatrixOne using a MySQL client, to avoid the output results from wrapping in the terminal, you can first execute the pager less -S command. After executing the command, the output result of the new EXPLAIN is no longer wrapped. You can press the right arrow→ key to scroll horizontally to read the output result.
Filter in Query History Query
Find the Query you want to know in the query history. Here we take Q1 of the system's own TPCH10G dataset as an example, as shown in the figure below:

View Query analysis
Click to enter this Query query details interface, and we can see its Query Profile interface at the same time, as shown in the figure below:
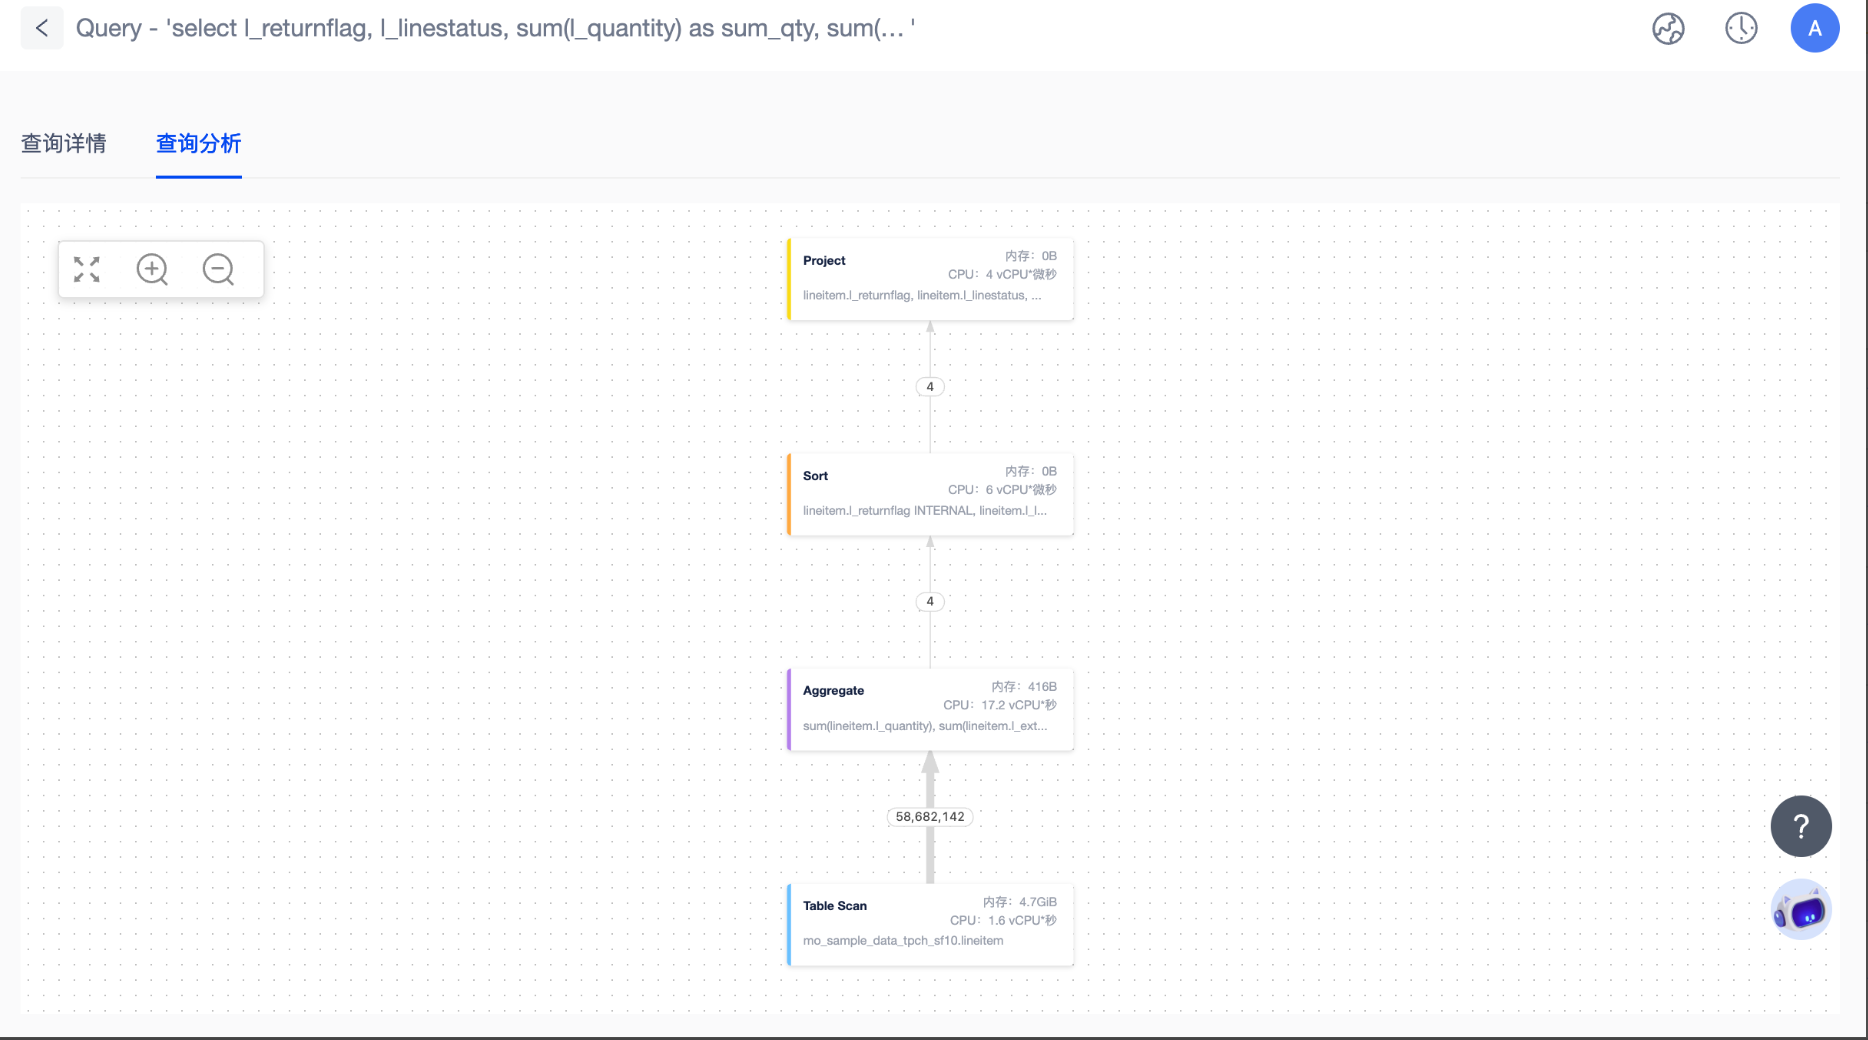
This interface shows the entire execution process of TPCH Q1, which is divided into 4 planning nodes in total: Table Scan, Aggregate, Sort and Project.
The direction of the arrow represents the steps to execute. First, we will scan the table mo_sample_data_tpch_sf10.lineitem to filter out the data for specific conditions. From the figure, we can see that the data that meets the conditions is 58,682,142 rows, which are used as input to the next node. Then, after aggregate (Aggregate) operation, output 4 rows, and then sort the data of these 4 rows according to the specified fields (Sort). Finally, select the column you want from the table, that is, project (Project) operation.
We can see that on each node block we indicate its operation object, execution details, and the CPU and memory resources consumed. For example, on the Table Scan node, we can see that its operation object is the table mo_sample_data_tpch_sf10.lineitem. At the same time, the CPU resources consumed by this operation are 1.6 core*s, and the memory consumed 4.7GB. These resource consumption is the basis for us to calculate the CU consumption. We will add the CPU and memory resources consumed by all steps according to a certain algorithm, that is, we will get the number of CUs consumed by this Query.
If we select the Click Table Scan node block again, we will see more details of the execution of the Table Scan node, as shown in the figure below:
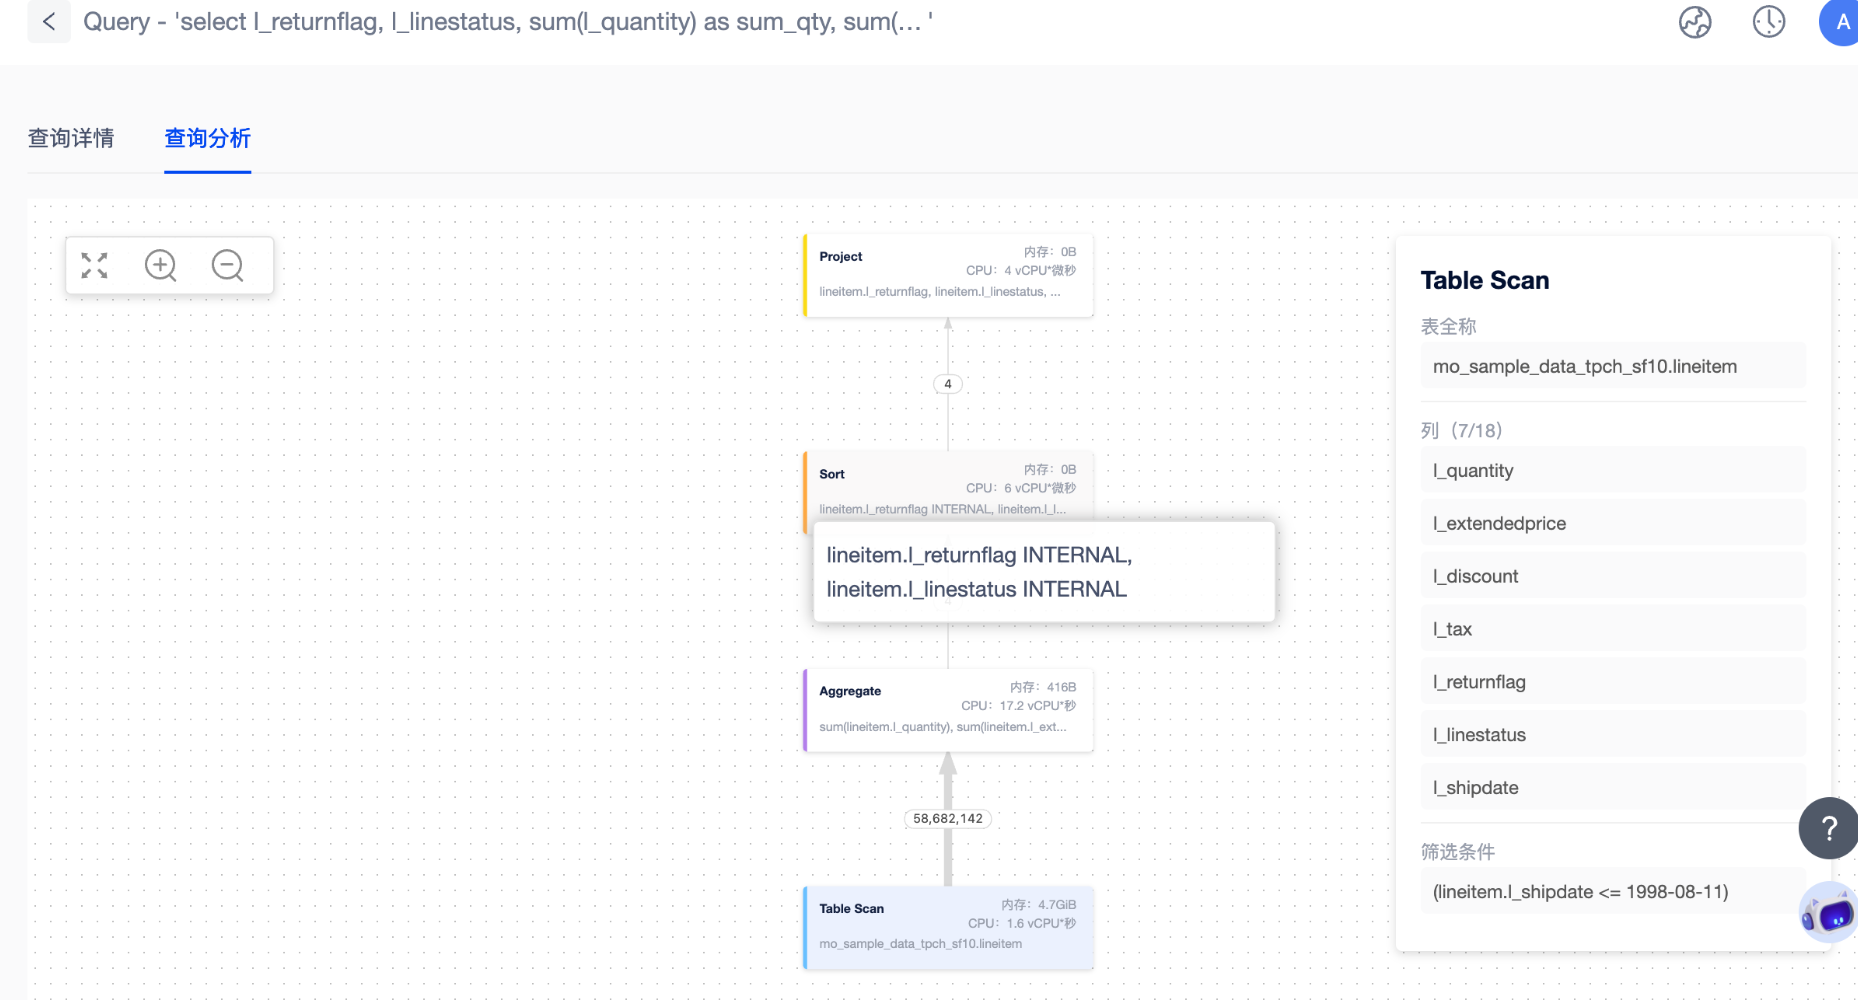
In this case, we can see that during the execution of the Table Scan node, 7 of the 18 columns are selected. (l_quantity, l_extendedprice, l_discount, l_tax, l_returnflag, l_linestatus, l_shipdate)is also included. It also contains a filtering condition(lineitem.l_shipdate <= 1998-08-11)`.
Understand MatrixOne's execution plan
For more detailed details and node types of MatrixOne execution plan, please refer to the Explain and Explain Output Format section description.