Monitoring indicators
This section will provide detailed information on the various monitoring metrics provided by MatrixOne Intelligence.
Instance Monitoring Indicators
The instance monitoring metric is the monitoring information of the operation and maintenance personnel serving the MatrixOne Intelligence instance management platform. You can click the instance name list in the upper right corner to switch the instance information you want to know, including: average number of connections, CU usage and storage usage. For the usage information of CU and storage, you can also directly click the instance you want to know on the instance interface and jump to the instance details to view.
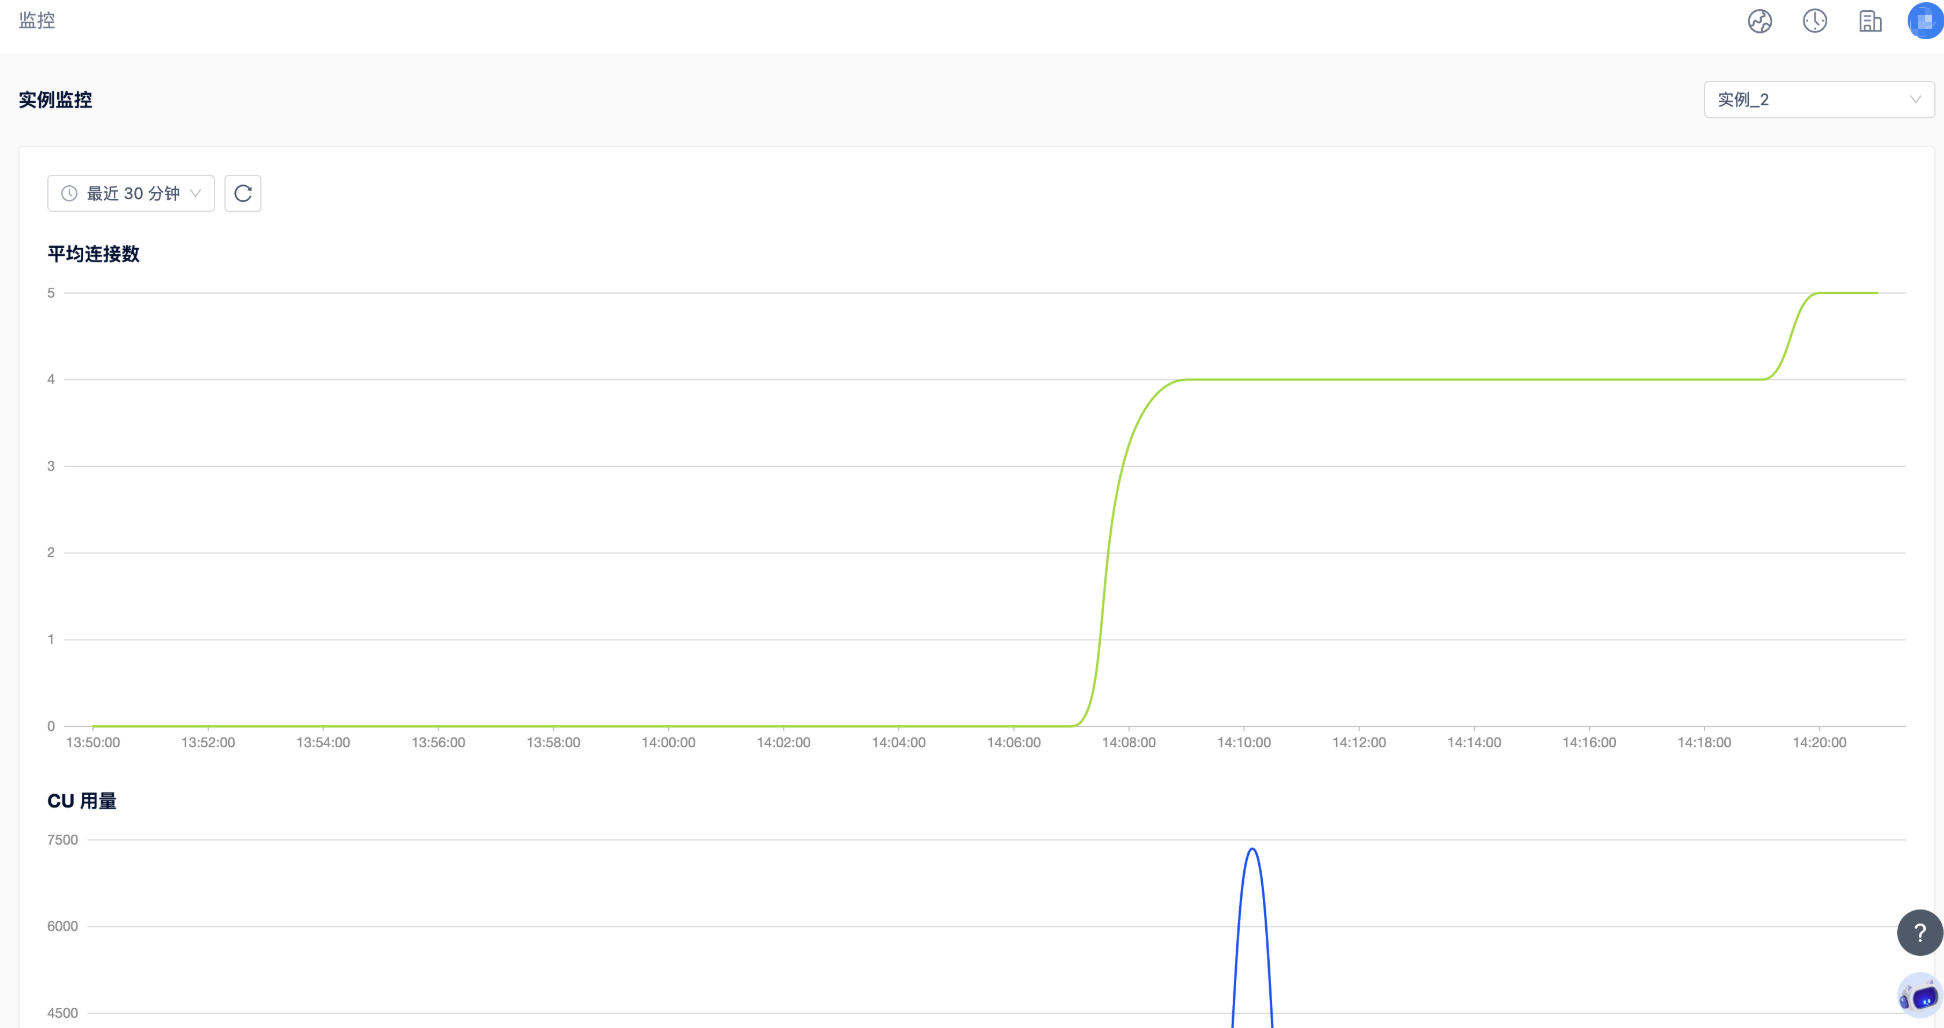
- Average number of connections
The average of sessions connected to the instance during the statistical period. The statistics are counted every 15s, and it is 0 when there is no connection, and the places earlier than the instance creation time are empty.
- CU usage
The total amount of CU consumed during the statistical period.
- Storage usage
During the statistical cycle, the maximum usage of data storage in the instance. The storage usage is updated every 15 minutes, reflecting the data 15 minutes ago.
Business monitoring indicators
Business monitoring metrics are monitoring information that serves data application personnel and can be found in the MatrixOne Intelligence database management platform, including:
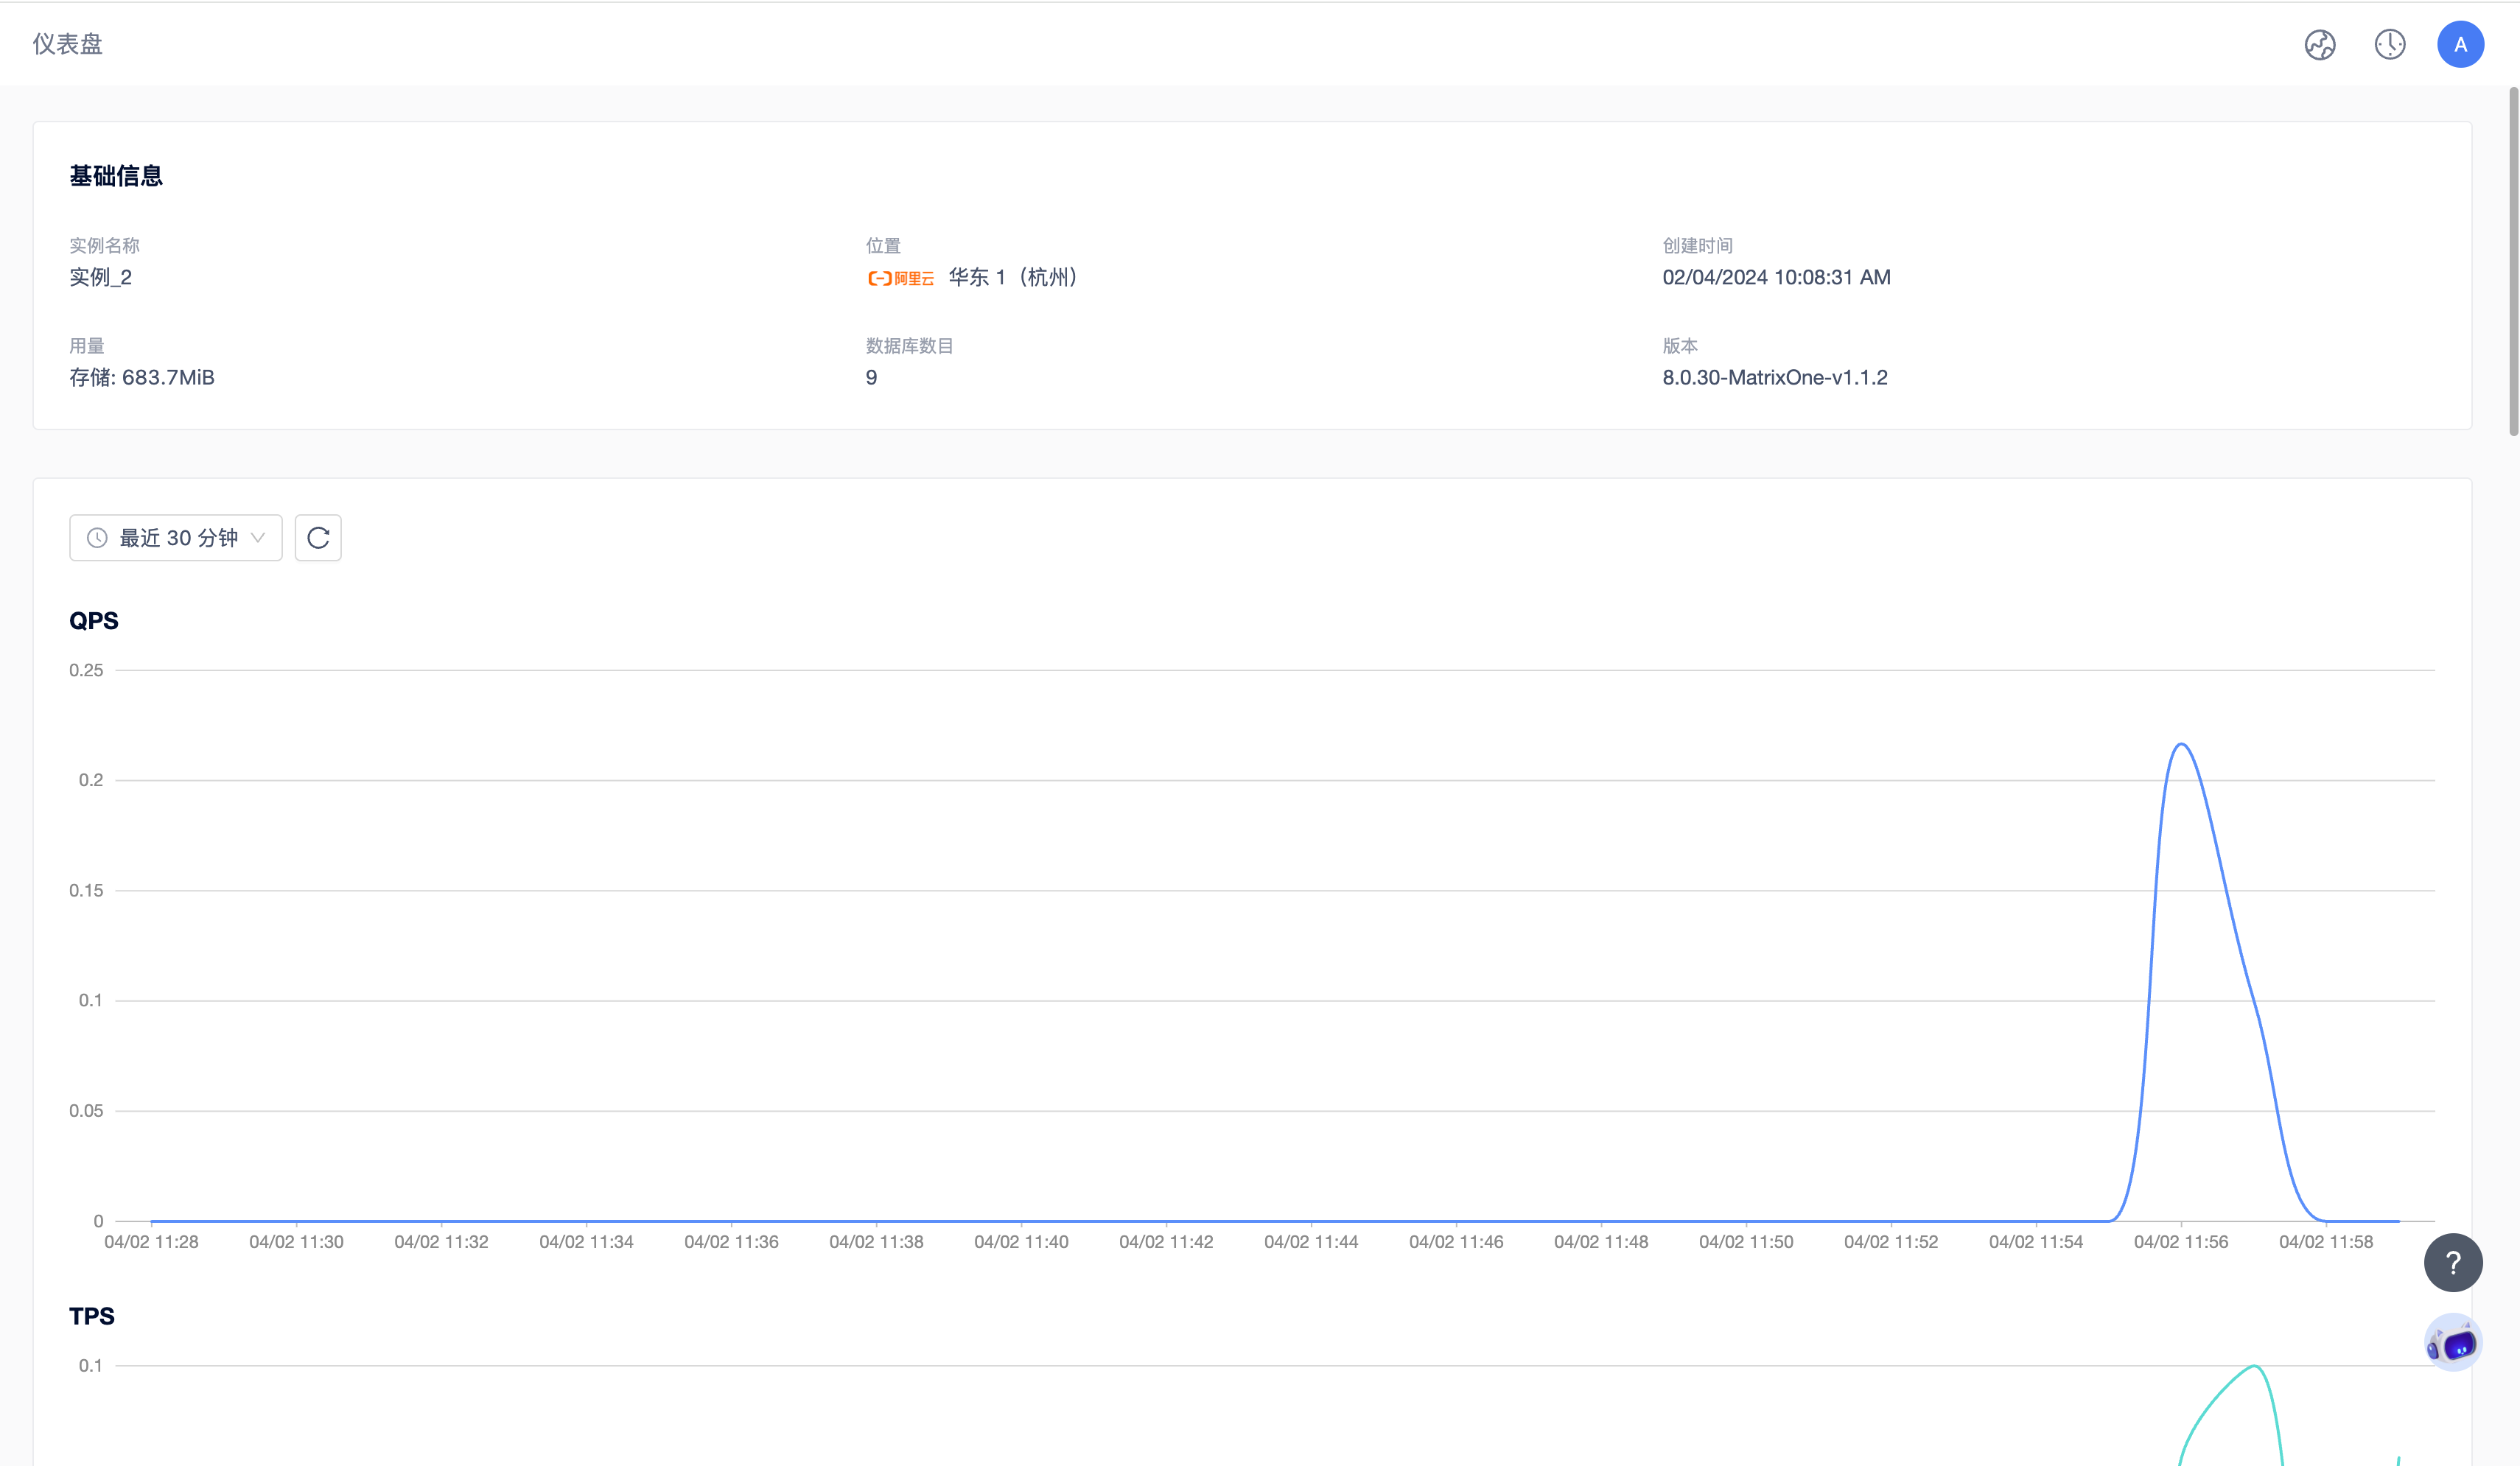
- Number of queries per second (QPS)
The average number of SQL queries completed per second represents the throughput capability of the instance.
- Number of transactions per second (TPS)
The average number of transaction queries completed per second reflects the database's ability to handle transactions within unit time.
- Query delay
The average execution time of each SQL query represents the running performance of the instance and is counted by SQL type.
- Total number of transactions
The total number of transactions executed during the statistical cycle.
- Number of transaction failures
The total number of transactions that failed to execute during the statistical cycle.
- Total SQL statements
The total number of SQL statements executed during the statistical cycle.
- SQL statement failure count
The total number of SQL statements that failed to execute during the statistical cycle.
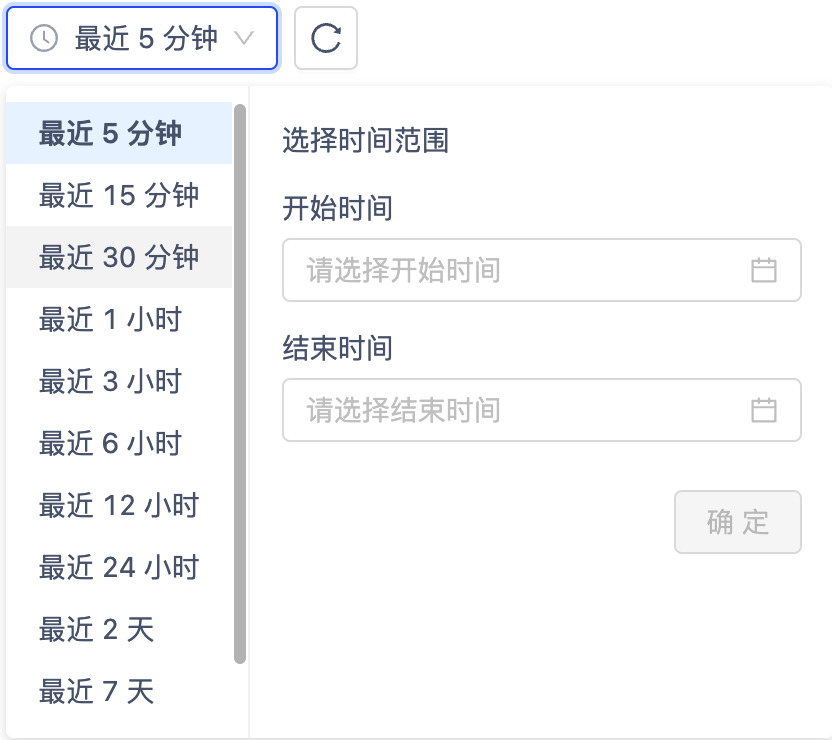
Statistical duration and statistics cycle
In order to help users analyze the performance and problems of instances from a macro and micro perspective, MatrixOne Intelligence provides a variety of statistical durations, each corresponding to different statistical periods, and the last 30 minutes of monitoring data is displayed by default, and users can switch freely as needed. As shown in the figure below:
Note
Shorter statistical cycles are better able to reflect recent changes in the business, while longer statistical cycles are more suitable for observing long-term trends and historical issues.